Download
1 / 9
90 likes | 91 Vues
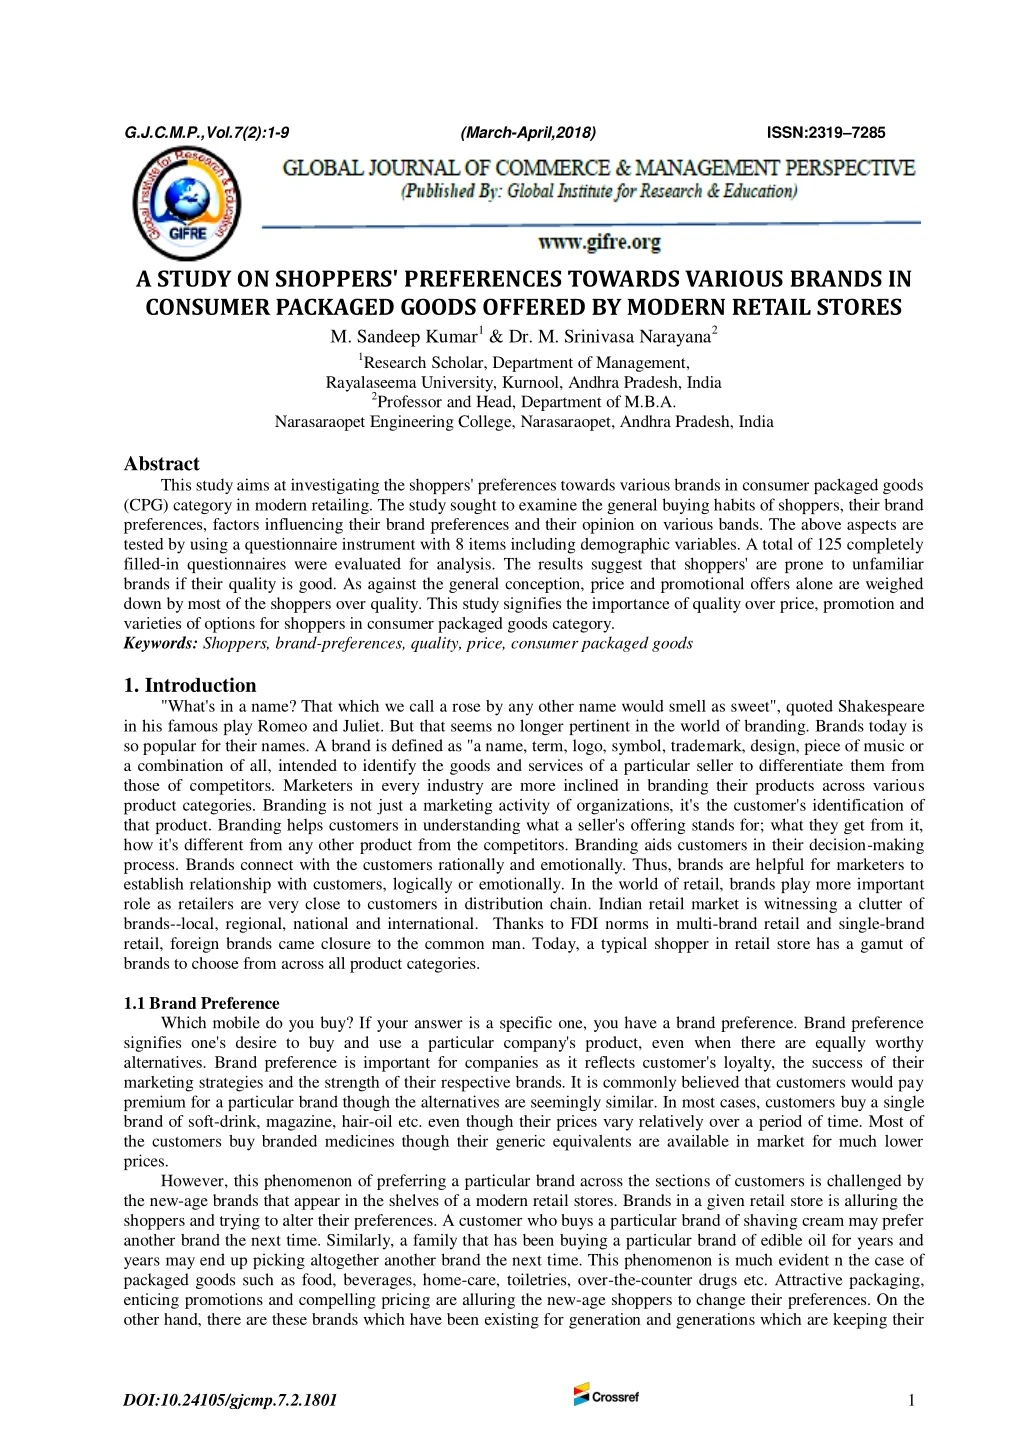
This study aims at investigating the shoppers' preferences towards various brands in consumer packaged goods<br>(CPG) category in modern retailing. The study sought to examine the general buying habits of shoppers, their brand<br>preferences, factors influencing their brand preferences and their opinion on various bands. The above aspects are<br>tested by using a questionnaire instrument with 8 items including demographic variables. A total of 125 completely<br>filled-in questionnaires were evaluated for analysis. The results suggest that shoppers' are prone to unfamiliar<br>brands if their quality is good. As against the general conception, price and promotional offers alone are weighed<br>down by most of the shoppers over quality. This study signifies the importance of quality over price, promotion and<br>varieties of options for shoppers in consumer packaged goods category.<br>

E N D
G.J.C.M.P.,Vol.7(2):1-9 (March-April,2018) ISSN:2319–7285 A STUDY ON SHOPPERS' PREFERENCES TOWARDS VARIOUS BRANDS IN CONSUMER PACKAGED GOODS OFFERED BY MODERN RETAIL STORES M. Sandeep Kumar1 & Dr. M. Srinivasa Narayana2 1Research Scholar, Department of Management, Rayalaseema University, Kurnool, Andhra Pradesh, India 2Professor and Head, Department of M.B.A. Narasaraopet Engineering College, Narasaraopet, Andhra Pradesh, India Abstract This study aims at investigating the shoppers' preferences towards various brands in consumer packaged goods (CPG) category in modern retailing. The study sought to examine the general buying habits of shoppers, their brand preferences, factors influencing their brand preferences and their opinion on various bands. The above aspects are tested by using a questionnaire instrument with 8 items including demographic variables. A total of 125 completely filled-in questionnaires were evaluated for analysis. The results suggest that shoppers' are prone to unfamiliar brands if their quality is good. As against the general conception, price and promotional offers alone are weighed down by most of the shoppers over quality. This study signifies the importance of quality over price, promotion and varieties of options for shoppers in consumer packaged goods category. Keywords: Shoppers, brand-preferences, quality, price, consumer packaged goods 1. Introduction "What's in aname? That which we call a rose by any other name would smell as sweet", quoted Shakespeare in his famous play Romeo and Juliet. But that seems no longer pertinent in the world of branding. Brands today is so popular for their names. A brand is defined as "a name, term, logo, symbol, trademark, design, piece of music or a combination of all, intended to identify the goods and services of a particular seller to differentiate them from those of competitors. Marketers in every industry are more inclined in branding their products across various product categories. Branding is not just a marketing activity of organizations, it's the customer's identification of that product. Branding helps customers in understanding what a seller's offering stands for; what they get from it, how it's different from any other product from the competitors. Branding aids customers in their decision-making process. Brands connect with the customers rationally and emotionally. Thus, brands are helpful for marketers to establish relationship with customers, logically or emotionally. In the world of retail, brands play more important role as retailers are very close to customers in distribution chain. Indian retail market is witnessing a clutter of brands--local, regional, national and international. Thanks to FDI norms in multi-brand retail and single-brand retail, foreign brands came closure to the common man. Today, a typical shopper in retail store has a gamut of brands to choose from across all product categories. 1.1 Brand Preference Which mobile do you buy? If your answer is a specific one, you have a brand preference. Brand preference signifies one's desire to buy and use a particular company's product, even when there are equally worthy alternatives. Brand preference is important for companies as it reflects customer's loyalty, the success of their marketing strategies and the strength of their respective brands. It is commonly believed that customers would pay premium for a particular brand though the alternatives are seemingly similar. In most cases, customers buy a single brand of soft-drink, magazine, hair-oil etc. even though their prices vary relatively over a period of time. Most of the customers buy branded medicines though their generic equivalents are available in market for much lower prices. However, this phenomenon of preferring a particular brand across the sections of customers is challenged by the new-age brands that appear in the shelves of a modern retail stores. Brands in a given retail store is alluring the shoppers and trying to alter their preferences. A customer who buys a particular brand of shaving cream may prefer another brand the next time. Similarly, a family that has been buying a particular brand of edible oil for years and years may end up picking altogether another brand the next time. This phenomenon is much evident n the case of packaged goods such as food, beverages, home-care, toiletries, over-the-counter drugs etc. Attractive packaging, enticing promotions and compelling pricing are alluring the new-age shoppers to change their preferences. On the other hand, there are these brands which have been existing for generation and generations which are keeping their DOI:10.24105/gjcmp.7.2.1801 1
customers' preferences towards them with no much change. It is however, interesting to find out the preferences of shoppers across the consumer packaged goods category and factors affecting their preferences towards various brands 2. Review of Literature To gain better understanding on the subject and to critically evaluate the study, a thorough review of various literature is carried out and the key excerpts are given under. Consumers’ preferences for products or brands arise from the combination of many different factors. Some factors come from features of the product itself (e.g., price, durability), while others are attributes of consumers themselves (e.g., goals, attitudes, discretionary income), (Venkatraman, Clithero, Fitzsimons, and Huettel, 2012). Ge, Brigden and Häubl (2015) proposed that consumers often make choices in settings where some alternatives are known and additional alternatives can be unveiled through search. When making a choice from a set of alternatives, the manner in which each of these was discovered should be irrelevant from a normative standpoint. Consumers must often decide between choosing among a set of previously discovered alternatives and searching to discover additional alternatives before making a choice. A substantial body of prior work examines consumer choice from pre-determined sets of alternatives. As a result, we know much about the influence of choice set composition and decision context on choice (Ge, Brigden, and Häubl, 2015). Aditionally, consumer characteristics such as patriotism, protectionism and social economic conservatism are effecting their choices (Spillan & Harcar, 2010). Often, consumers will tend to choose a brand that they consider congruent with their self-image. In this particular way each consumer at an individual basis will try to reflect his or her own identity through choice. When part of a larger social group, consumer choices tend to converge to a certain pattern thus forming the basics of an individual social identity (Cătălin, Andreea, 2014). Brand preference is regarded as a key step in consumer decision making, involving elements of choice. In establishing brand preference, consumers compare and rank different brands by focusing on their uniqueness defined brand preference as “the extent to which the customer favors the designed service provided by his or her present company, in comparison to the designated service provided by other companies in his or her consideration set,” with a consideration set referring to brands that a consumer would consider buying in the near future (Jin & Weber, 2013). Also, customer’s advisory has a positive effect on establishing a positive effect on brand and consumer preferences (Güngör & Bilgin, 2011). Karjaluoto et al (2005) conducted a research to find out the factors influencing consumer choice of mobile phones. The study uses focus group interview with 79 graduate students followed by a survey of 196 respondents. Price, brand, interface, and properties are the factors which affects purchasing behaviour of mobile phones in Finland. Gihan Wijesundera et al (2008) try to find out Factors Influencing the Demand of Beauty Soap among Female Consumers in the Greater Colombo Region. Purpose of this study is to explore how the marketing mix & demographical factors influence the brand preference & purchasing behaviour of beauty soap among the female consumers in the greater Colombo region. Sample consisted of 91 female consumers in greater Colombo region. Data were gathered by administrating questionnaires. The independent variables are 4Ps, Age, Income Level, Education, Marital status, Occupation, skin type, social factors, substitute products & dependent variable is the brand preference. Analysis was done using the Chi-square method at the significant level of 0.05. The results indicated that there were statistical relationships between price, product, education, occupation and band preference and there was no statistical relationship between place, promotion, age, income level, marital status, skin type, social factors, and substitute product with the brand preference. Bikash et al (2010) studied the factors influencing purchasing of Nano cars. This study attempts to find the factors, which are important for choosing the revolutionary car ‘Nano’ launched by one of the leading Indian automobile industry called ‘Tata Motors’. The report published by Cygnus research ranked Indian automobile sector to be number one on the basis of sales growth and Profit After Tax (PAT) growth during October- December 09 over October- December 08 over other 14 manufacturing sectors. The paper considers 22 factors, which may be important in the customer decision-making process. The factors are price is a affordable, because of Tata product, many love the name "Nano", available in attractive colours, style/look, high fuel efficiency, financing option, interior design, comfortable, space inside, value for money, environment friendly, running cost, warranty, power, status / prestige, safety features, resale value, accessories available, performance. Sääksjärvi and Samiee (2011) examined the relationships among brand identity, brand image, and brand preference in the context of cyber and offline-based extension retail brands over time. They examined a conceptual model with survey data collected over three time periods and found out that offline-based extension brands had an advantage over cyber brands when it came to translating a brand identity into a successful brand image, especially in the early Internet stages. Zeenat Ismail et al (2012) find out the Factors Affecting Consumer Preference of International Brands over Local Brands. This study was conducted in order to determine the consumer preferences of global brands instead of local ones. The research was conducted in Karachi and the samples selected included 200 people of age 16-24. The data collected for the research was through a questionnaire and was conducted in two popular shopping malls of the city and two universities since the target audience was largely the youth. Calculations were then analysed and interpreted using a percentage of respondents and through frequency distribution tables and charts. There are a number of factors affect the consumer purchase decisions. The results suggest that most important factors that influence a consumer’s final decision are the price and quality of the DOI:10.24105/gjcmp.7.2.1801 2
product in question. Since the consumers usually associate the price of the brand with its quality, a brand priced too low is generally perceived as a low quality product. Similarly, a product priced too high may not be affordable by many. Other factors that have an impact on the consumer preferences are: consumer ethnocentrism, country of origin, social status, price relativity with the competing brands and family and friends. Azad et al (2013) present an exploration study to detect important factors influencing car accessory market. The proposed study designs a questionnaire in Likert scale consists of 16 questions, distributes it among 200 experts and analyses it using factor analysis. Cronbach alpha and Kaiser-Meyer-Olkin Measure of Sampling Adequacy are calculated as 0.823 and 0.863, which validate the overall questionnaire. The results indicate that there are three influencing factors including brand capability, brand characteristics and consumers’ believe. Prasanna et al (2013) conducted a study to find outfactors influencing customers’ brand preferences of the economy segment SUV’s and MUV’s. A total of 143 respondents were included among which 98 met the target group criteria set for the study. The data collection was made through direct interaction and customer intercepts survey using printed questionnaires. Descriptive Analysis was used to transform data into understandable format and factor analysis was used for identification of factors influencing customer preference. Friedman’s test was used to identify the prominent emotions customers associated to the utility vehicle. The study identified the six factors that influence brand preference they are Product reliability, monetary factor, trendy appeal, frequency of non-price promotions offered, trustworthiness and customer feeling or association towards brand. Malviya et al (2013) said about brand preference on the basis of research conducted on the Factors Influencing Consumer’s Purchase Decision towards Smartphones in Indore. The basic purpose of the research is to identify the key factors which have a dominating effect on the consumers’ minds while making a purchase of Smartphone. The collected data were analysed and interpreted using chi-square, reliability analysis, Factor analysis, Confirmatory Factor Analysis. It was found that data is reliable for factor analysis. The measurement model suggested four factors price, brand preference, social influence and features having a dominant influence on the purchase decision of consumers in Indore. 3. Objectives of the Study In the above backdrop, the study aims at gaining more practical insights on shoppers' preferences towards various brands in consumer packaged goods (CPG) in modern retailing with the following objectives. 1.To study the buying habits of shoppers 2.To find out shoppers' brand preferences 3.To determine the factors influencing their brand preferences. 4.To elicit the opinion of customers towards their various brands. 4. Scope of the Study The inferences from the study are based on the responses given by the customers in a specific area. This study is helpful in getting insights on brand preferences of middle and higher socio-economic group of customers of shopping mall in Vijayawada. A few of the findings may be deviating towards retail stores present in the mall at the time of survey as the survey was carried out in the premises of the mall. It may not fully reflect the brand preferences of shoppers as the responses of the participants of the survey might be biased. 5. Research Methodology 5.1 Research Design The study is based on both primary data and secondary data. The primary data was collected through structured questionnaire. A sample of 150 questionnaires were distributed and 132 questionnaires were collected back. Out of them, 7 questionnaire forms were excluded for missing data. Thus, exactly 125 (83%) completed forms were evaluated for further analysis. The data was collected during April 2018 in Vijayawada at PVP Square Mall. H1: There is no significant difference between occupation and frequency of buying CPGs H2: There is no significant difference between level of education and brand selection H3: There is no significant difference between gender and opinion on brands 5.2 Research Approach Survey method is used for collecting data from customers randomly chosen from various retail outlets and showrooms at a shopping mall. Respondents were requested to respond to various questions and the responses were recorded in the questionnaire. The questionnaire contained both open and close-ended questions in a structured format. 5.3 Sampling Technique Convenience sampling (a non-probability sampling method) technique is used to pick 150 shoppers at PVP Square Mall in Vijayawada. The members of the sample selected were requested to participate in the survey voluntarily. DOI:10.24105/gjcmp.7.2.1801 3
5.4 Data Analysis Out of 150 survey forms distributed, 125 forms were found to be suitable for analysis. For the purpose of analysis and interpretation, only the primary data is used. However, for conclusion and recommendations both primary and secondary data along with the information obtained from observation is used. The data collected from these sources were analyzed using various tools like percentage analysis, Chi-square test and cross table analysis. 5.5 Tools Frequencies and cross tabulation have been calculated for the responses of the respondents. Chi-square test was conducted on the data to test the significance of the hypotheses. 6. Analysis and Interpretation 6.1 Profile of the Respondents Male Female 78 (62.4) 47 (37.6) 18-25 26-35 22 (17.6) 33 (26.4) Gender 36-45 57 (45.6) Post-graduation & Above 49 (39.2) Employed - Public Sector 12 (9.6) 25,000-40,000 Above 45 13 (10.4) Age Below graduation Graduation Education 32 (25.6) 44 (35.2) Employed - Private Sector 57 (45.6) 11,000-25,000 Professional / Business 33 (26.4) Above 40,000 Student Occupation 23 (18.4) Below 10000 Monthly Individual Income (in INR) 32 (25.6) 47 (37.6) 46 (36.8) Figures in brackets represent percentage values of the corresponding numbers 6.1.1 Interpretation With 63%, men dominated the survey over women. On further classification based on age, adults (36-45) dominated the survey constituting around 46% of the respondents. Next comes young adults (26-35) with 26% and youth (18-25) with 17%. Elders (Above 45) represent low with just 10%. This signifies that adults and young adults are active shoppers than youngsters and elders. Most of the respondents are either post-graduates (39%) or graduates (35%). Non-graduates comprises only 37%. This specifies that most of the shoppers are well educated. Most of the shoppers surveyed (46%) are employed in private sector. Coming to monthly individual income, a considerable number of the respondents fall under either below 10000 (34%) or between INR 11,000 and 25,000 (38%). A minuscule 14% are earning above INR 25,000. This denotes that a good majority of the respondents belong to middle SEC (socio-economic class). Higher SEC represent low in the survey. 6.2 Buying Habits of Shoppers How often do you buy consumer packaged goods (CPG)? 46 (36.8) Every week Once in a month 58 (46.4) As and when required 18 (14.4) Once in a while 3 (2.4) Which types of brands satisfies your needs and requirements? Familiar brands Unfamiliar brands 23 (18.4) Unbranded products 7 (5.6) Can't say 73 (58.4) 22 (17.6) Which CPG items do you mostly buy at this store? Personal-care 35 (28) Home-care 46 (36.8) Toiletries 44 (35.2) Figures in brackets represent percentage values of the corresponding numbers 6.2.1. Interpretation The above table unearths the brand preferences customers. It is found that a majority of the respondents (46%) buy CPG monthly and 37% buy them every week. This means most of the respondents are frequent buyers of CPG. Most of the shoppers (59%) believe that familiar brands would satisfy their various needs and requirements. Surprisingly, a significant percentage of them (18%) believe unfamiliar brands do better. A very little percentage of DOI:10.24105/gjcmp.7.2.1801 4
the shoppers (6%) opine that unbranded items work better for them. Home-care (37%) is the mostly bought CPG items by shoppers. Toiletries (35%) and Personal-care (28%) comes next. 6.3 Factors Influencing Brand Preferences What is your general brand-choice behavior 21 (16.8) 46 (36.8) How would you react if your favorite brand is not available brands 17 (13.6) 102 (81.6) Most important factor in choosing a brand 27 (21.6) 3 (2.4) 6.3.1 Interpretation From the above data, it can be found that majority of the shopper are innovators. They (46%) always try out new brands. Also a good percentage of them (37%) pick brands that come with a discount or any offer. Only a few of them (17%) always stick to a single brand. This signifies that only a few of the shoppers are hard-core loyals. If the favorite brand is not available in store at that moment, a majority (82%) preferred to go for brands available at the moment. Rest of them either try at other stores (14%) or postpone their buying (2%) or Place an order with the store (2%). This reflects the loyalty of the shoppers towards their favorite brands. In choosing a brand, quality(25%), promotional offers (23%) and price (22%) plays dominant roles. Fancy advertising messages (18%) brand image (10%) doesn't have much significant role to play. This signifies that most of the shoppers are quality- conscious and not brand-conscious. 6.4 Shopper's Opinion on Various Brands What is your general opinion on brands available in this store? 22 (17.6) 25 (20) 6.4.1 Interpretation Above data reveals that shoppers' have equal opinion on various aspects of brands offered by their favorite store. While they have relatively equal opinion that their favorite store offers brands with consistently good quality (22%), wide varieties of brands (21%), brands with attractive offers (20%), and offers latest brands always (20%), a slightly less percentage of them (18%) agreed that the prices at their favorite store is lower than the prices offered by other stores. This indicates that price is not a pull factor compared to quality and promotional offers. 6.5 Chi-Square Test 6.5.1. Occupation and Frequency of Buying CPG Is there any Relation between Occupation of the respondents and their Frequency of Buying CPG? Ho: Occupation and Frequency of Buying are not dependent H1: Occupation and Frequency of Buying are dependent Frequency of Buying Every Week Month Students 11 7 Employed - Private Employed - Public Professional / Business Total 46 58 Always stick to one brand Pick brands with offers Always try new brands 58 (46.4) Postpone buying Try at other stores Go for available Place an order for the favorite brand 2 (1.6) Advertising 2 (1.6) Brand Image Price Availabilit y Promotional Offers 29 (23.2) Quality 13 (10.4) 22 (17.6) 31 (24.8) Prices lower than other stores Attractive offers on brands Brands' quality is consistently good 27 (21.6) Always latest brands 25 (20) Wide varieties of brands 26 (20.8) Every As and When Required 5 7 Once in a While 0 1 Total 23 57 Occupation 13 36 4 4 3 1 12 18 11 3 1 33 125 18 3 DOI:10.24105/gjcmp.7.2.1801 5
Degree of freedom (df) = 9, Level of Significance = 5% Critical Value = 15.507 (from table) Expected Values Frequency of Buying Every Week Month 8.5 10.7 21.0 26.4 Every As and When Required 3.3 8.2 Once in a While 0.6 1.4 Total Students Employed - Private Employed - Public Professional / Business Total 23 57 Occupation 4.4 5.6 1.7 0.3 12 12.1 15.3 4.8 0.8 33 125 46 58 18 3 Contingency Table O-E (O-E)2 (O-E)2/E O 11.0 7.0 5.0 0.0 13.0 4.0 18.0 46.0 18.0 11.0 3.0 1.0 E 8.5 10.7 3.3 0.6 21.0 26.4 8.2 1.4 12.1 15.3 4.8 0.8 2.5 -3.7 1.7 -0.6 -8.0 -22.4 9.8 44.6 5.9 -4.3 -1.8 0.2 6.3 13.7 2.9 0.4 64.0 501.8 96.0 1989.2 34.8 18.5 3.2 0.0 0.7 1.3 0.9 0.6 3.0 19.0 11.7 1420.8 2.9 1.2 0.7 0.1 1462.9 Chi-square calculated = 1462.9 Chi-square from table = 15.507 Since, calculated value of Chi-square is much higher than table value, Ho is rejected. Inference: Occupation and Frequency of Buying are dependent 6.5.2. Level of Education and Brand Selection Is there any Relation between Level of Education and Brand Selection? Ho: Level of Education and Brand Selection are not dependent H1: Level of Education and Brand Selection are dependent Brand Selection Familiar Brands Unfamiliar Brands Unbranded products Can't Say Level of Education Total Below graduation 13 8 3 8 32 Graduation 25 6 2 11 44 Post-graduation 35 9 2 3 49 125 Total 73 23 7 22 DOI:10.24105/gjcmp.7.2.1801 6
Degree of freedom (df) = 6 Level of Significance = 5% Critical Value = 12.529 (from table) Expected Values Brand Selection FB 18.7 Level of Education UnFB 5.9 UnBP 1.8 CS 5.6 Total 32 Below graduation Graduation 25.7 8.1 2.5 7.7 44 Post-graduation 28.6 73 9.0 23 2.7 7 8.6 22 49 125 Total Contingency Table (O-E)2 32.5 (O-E)2/E O E O-E 13.0 8.0 3.0 8.0 25.0 6.0 2.0 11.0 35.0 9.0 2.0 3.0 18.7 5.9 1.8 5.6 25.7 8.1 2.5 7.7 28.6 9.0 2.7 8.6 -5.7 2.1 1.2 2.4 -0.7 -2.1 -0.5 3.3 6.4 0.0 -0.7 -5.6 1.7 0.7 0.8 1.0 0.0 0.5 0.1 1.4 1.4 0.0 0.2 3.6 11.7 4.4 1.4 5.8 0.5 4.4 0.3 10.9 41.0 0.0 0.5 31.4 Chi-square calculated = 11.7 Chi-square from table = 12.529 Since, calculated value of Chi-square is lower than table value, Ho is accepted. Inference: Level of Education and Brand Selection are not dependent 6.5.3. Gender and Opinion on Brands Is there any Relation between Gender of the respondents and their opinion on Brands they buy? Ho: Gender and Opinion on Brands are not dependent H1: Gender and Opinion on Brands are dependent Opinion on Brands LP AO BQ ALB WVB Total Male 13 16 17 15 17 78 Gender Female 9 9 10 10 9 47 Total 22 25 27 25 26 125 Degree of freedom (df) = 4, Level of Significance = 5% Critical Value = 7.815 (from table) DOI:10.24105/gjcmp.7.2.1801 7
Expected Values Opinion on Brands AO LP BQ ALB WVB Total Gender Male 13.7 15.6 16.8 15.6 16.2 78 Female 8.3 9.4 10.2 9.4 9.8 47 125 Total 22 25 27 25 26 Contingency Table (O-E)2 (O-E)2/E O E O-E 13.0 13.7 -0.7 0.5 0.0 16.0 15.6 0.4 0.2 0.0 17.0 15.0 17.0 9.0 9.0 10.0 10.0 9.0 16.8 15.6 16.2 8.3 9.4 10.2 9.4 9.8 0.2 -0.6 0.8 0.7 -0.4 -0.2 0.6 -0.8 0.0 0.4 0.6 0.5 0.2 0.0 0.4 0.6 0.0 0.0 0.0 0.1 0.0 0.0 0.0 0.1 0.3 Chi-square calculated = 0.3 Chi-square from table = 7.815 Since, calculated value of Chi-square is lower than table value, Ho is accepted. Inference: Gender and Opinion on Brands are not dependent 7. Findings 1.37% of respondents buy Consumer Packaged Goods (CPG) every week, while 46% buy every month. 2.58% of the respondents buy familiar brands in CPG, while 18% buy unfamiliar brands. 3.37% of the people surveyed buy Home-care products, 28% buy Personal-care and 35% buy Toiletries under CPG. 4.46% of the shoppers surveyed try new brands always. 17% of them stick to a single brand. 37% of the respondents surveyed are open to brands with offers. 5.For 25% of the respondents, Quality is the most important factor in choosing a brand. 6.For 23% of the respondents, Promotional Offers is the most important factor in choosing a brand. For 21% of them, it's Price. 7.For 10% of the total respondents, Brand Image the most significant factor in choosing a brand. 8.17% have the opinion that prices of the brands in their favorite store is lower than prices at competitors' stores. 9.22% of the respondents said Brands they generally buy are keeping quality consistently. 10.Around 20% of the people surveyed said that Attractive Offers on Brands, always availability of Latest Brands and availability of Wide Varieties of Brands are the most compelling reasons in choosing a particular brand. 8. Conclusion The purpose of the study was to examine the shoppers' preferences towards various brands in consumer packaged goods (GPG) offered by modern retail stores. The study reveals several interesting findings. The test conducted under the study proves that there is significant relationship between occupation of the respondents and frequency of buying CPGs. However, the test also proves that level of education has no significant relationship on brand selection. Similarly, it is also found that gender of the respondents and their opinion on brands are not dependent. Furthermore, the study reveals that while familiar brands are preferred by most of the respondents, DOI:10.24105/gjcmp.7.2.1801 8
unfamiliar brands are also preferred by a significant number of respondents. While a few of the respondents stick to a single brand in CPG category, most of them are always open to new brands. This signifies that most of the respondents are not hard-core loyals. This result is further strengthened by the alternative behavior of shoppers, i.e., going for other available brands, in case the favorite brand is not available. Quality is playing a dominant role over price, promotion and advertising in choosing a brand. Moreover, the test reveals that quality, availability of wide varieties of latest brands and attractive offers are driving them to prefer branded items in CPG category. The study is comes as a revelation to modern retailers who wish to understand more the buying behavior and brand preferences of customers. The study suggests that modern retailers may rope in new brands more, as long as there are different from the existing ones and are of good quality. The findings further reveals that promotional offers and discounts alone are not crowd-pullers. They work good only when coupled with good quality. References Barry Berman, Joel Evans R., "Retail Management a Strategic Approach", tenth edition Pearson Education Inc., Dorling Kindersley Publishing Inc., 2007 Burman Barry and Evans Joel, "Retail Management: A Strategic Approach". 10th ed., Prentice Hall. Pearson Education Inc., Dorling Kindersley Publishing Inc., 2006. Dunne Patrick M. and Lufsch Robert F., ―"Retailing" 6th edition Thomson Learning Inc., 2008 Dale Gillan and Banfield Graham, "Retailing and distribution: A First Cours,." U.K., Pitman, 1985 Gilbert David, "Retail Marketing Management" ,2nd ed., Pearson Education, 2003 Hamilton Ryan, “Assortment size and option attractiveness in consumer choice among retailers”, Journal of Marketing Research, Vol. XLVI, pp. 410-420, 2009. Hayiel Hino (2010), "Antecendents of SUpermarket Format's Adoption and Usage: A Study in the Context of Non-westren Customers", Journal of Retailing and Consumer Services, Vol.17, Issue 1, pp61-72. Kaltcheva Velitchka D., "When Should a Retailer Create an Exciting Store Environment?" Journal of Marketing, Vol. 70 pp. 107–118, 2006. Kaufman Peter, Jayachandran Satish, and Rose Randall L., Journal of Marketing Research, Vol. XLIII pp. 580–587, 2006. Kumar A., Kim Y.K. and Pelton L., "Indian Consumer‘s purchase behavior towards US versus local brands" , International Journal of Retail and Distribution Management, Vol.37 No.6, pp.510-526, 2008. Levy Michael and Weitz Barton, Retailing Management, McGraw Hill. Pearson Education Inc., Dorling Kindersley Publishing Inc., 2008. Loudon David L. and Bitta Della A.J., Consumer Behavior, 4th Edition, McGraw-Hill Education (ISE Editions), 1993. Nair Suja, Retail Management, 1st ed., Himalaya Publishing House New Delhi, 2008 Newmen Andrew and Cullen Peter, "Retailing: Environment and Operations", Cengage Learning, 2003. Saeed Samiee, Leslie S.C. Yip and Sheriff T.K. Luk (2004), "International Marketing in Southeast Asia: retailing Trends and Opportunities in China", International Marketing review, Vol. 21, Issue 3, pp247-254. Sandeep Kumar Machavolu, Raju K.V.V. (2014), "Consumer Orientation towards Store Brands Vis-à-vis Name Brands", IOSR Journal of Business and Management pp. 85-93 Sandeep Kumar Machavolu, Dr. M. Srinivasa Narayana (2018), "A Study on Habits and Preferences of Customers Towards hopping at Modern Retail Stores", Global Journal of Commerce and Management Perspective, Vol.7, Issue-1, pp7-14. Sinha Piyush K. and Banerjee Arindam, "Store Choice Behavior in An Evolving Market", International Journal of Retail and Distribution Management", Vol. 32, No. 10, pp. 482-49, 2004. DOI:10.24105/gjcmp.7.2.1801 9