Download
1 / 30
300 likes | 364 Vues
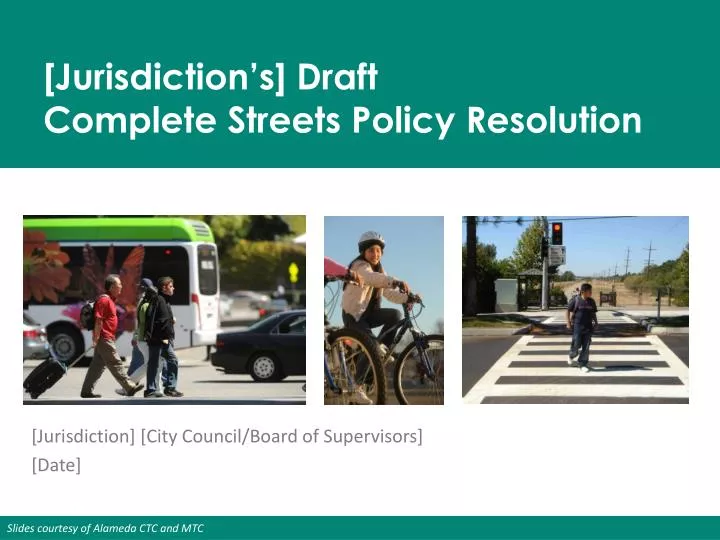
[Jurisdiction’s] Draft Complete Streets Policy Resolution. [Jurisdiction] [City Council/Board of Supervisors] [Date]. What are Complete Streets?.

E N D
[Jurisdiction’s] Draft Complete Streets Policy Resolution • [Jurisdiction] [City Council/Board of Supervisors] [Date]
What are Complete Streets? Complete Streets are safe, comfortable, and convenient for travel for everyone, regardless of age or ability – motorists, pedestrians, bicyclists, and public transportation riders.
San Leandro Road Diet After Before
Complete Streets Serve All Users • Pedestrians • Bicyclists • Transit Users • Motorists • Goods Movement • People with Disabilities • People of All Ages & Abilities • Emergency Responders
Benefits of Complete Streets • Improved safety • Increased mobility for all users and modes • Improved air and water quality • Improved public health • Enhanced economic competitiveness • Increased livability
Improved Safety • Bicyclists and pedestrians are disproportionately represented in crash rates • Designing streets for all users reduces crashes • In Santa Monica, a street reconfiguration reduced crashes by 65%1 California Highway Patrol 1998 to 2007 Bay Area Collisions; American Community Survey Work Trips (2009)
Increased Transit Ridership • Sidewalks and crossings encourage transit use • Walkable neighborhoods of King County, WA have higher public transportation shares2 • Improving efficiency and reliability makes transit more appealing • A priority signal system in Los Angeles decreased travel time by 25% and increased ridership by more than 30%3
Increased Walking and Bicycling • Pedestrian facilities encourage walking • Residents are 65% more likely to walk in a neighborhood with sidewalks4 • Bicycle facilities encourage biking • Cities with more bike lanes per square mile have higher levels of bicycle commuting5 • San Francisco’s improvements on Valencia Street resulted in 1.4 times more cyclists and 36% fewer pedestrian collisions1
Growth in Walking and Biking in Alameda County Walking represents 11% of all trips, and 2% of trips are completed by bike in Alameda County (2000). Percent Change in PM Pedestrian Counts Relative to 2002 Percent Change in PM Bicycle Counts Relative to 2002 Source: Census 2000 and Alameda County Transportation Commission Bicycle & Pedestrian Surveys
Increased Mobility for People with Disabilities and Older Adults • Older pedestrians are more at risk • In 2008, older pedestrians represented 18% of the fatalities but were only 13% of the population nationwide6 • Seniors are more isolated • Non-driving seniors make 65% fewer trips to visit family, friends or go to church7 • Pedestrians with disabilities require additional design consideration • Blind pedestrians wait three times longer to cross the street than sighted pedestrians8
Reduced Air Pollution from Transportation • Transportation is a major source of air pollution • 75% of air pollution emissions in the Bay Area are from mobile sources (particularly cars & light duty trucks)9 • Many trips could be walkable or bikeable • 40% of all trips are < 2 miles
Reduced Obesity Obesity is lower in places where people use bicycles, public transportation, and their feet10 Source: Pucher, “Walking and Cycling: Path to Improved Public Health,” Fit City Conference, NYC, June 2009
Healthier Children Safe Routes to Schools, which is part of Complete Streets, is growing in Alameda County Nationally, fewer than one-third of children participate in 20 minutes of physical activity11
Federal Regional OBAG Local Resolution by January 2013 Regional Complete Streets Checklists Regional Compliance with State Requirement by 2014 State, Regional, and County Policy Requirements State Caltrans DD64 R-1 State CA Complete Streets Act of 2008 County TEP: Complete Streets in All Projects County Master Funding Agreement: Policy by June 2013
Complete Streets Policy Requirements Complete Streets Policy Resolution Required for Regional and Local Funding:
Policy Resolution: 10 Elements Needed to Comply with Alameda CTC and MTC Requirements • Vision • All Users and Modes • All Projects/Phases • Exceptions • Network/ Connectivity • Jurisdiction • Design • Context Sensitivity • Performance Measures • Implementation Next Steps
1. Vision [Insert language from your resolution that addresses this element.]
2. All Users and Modes [Insert language from your resolution that addresses this element.]
3. All Projects/Phases [Insert language from your resolution that addresses this element.]
4. Exceptions [Insert language from your resolution that addresses this element.]
5. Network/Connectivity [Insert language from your resolution that addresses this element.]
6. Jurisdiction [Insert language from your resolution that addresses this element.]
7. Design [Insert language from your resolution that addresses this element.]
8. Context Sensitivity [Insert language from your resolution that addresses this element.]
9. Performance Measures [Insert language from your resolution that addresses this element.] Actual 5 min. walk (1/4 mi) Actual 10 min. walk (1/2 mi)
10. Implementation Next Steps [Insert language from your resolution that addresses this element.]
Next Steps • Implementing our Complete Streets Policy • [insert local next steps] • [insert local next steps] • General Plan Amendment • State, regional, and county requirements • Late 2014 deadline for OBAG funding Actual 5 min. walk (1/4 mi) Actual 10 min. walk (1/2 mi)
Resources for Locals • MTC is offering workshop on policy development and implementation • Alameda CTC • Local tools and sample documents • Complete Streets resources web page • Additional support under development
Sources • National Complete Streets Coalition and Local Government Commission. 2012. Complete Streets in California: It’s a Safe Decision. • Lawrence Frank and Company, Inc. 2005. A Study of Land Use, Transportation, Air Quality, and Health (LUTAQH) in King County, WA. • Los Angeles County Metropolitan Transportation Authority. 2002. Metro Rapid Demonstration Program, Final Report. • Giles-Corti, B., & R.J. Donovan. 2002. The relative influence of individual, social, and physical environment determinants of physical activity. Social Science & Medicine, 54 1793-1812. • Dill, J. & T. Carr. (2003). Bicycle Commuting and Facilities in Major US Cities: If You Build Them, Commuters Will Use Them. Transportation Research Record:, No. 1828, TRB, pp 116-123. • National Highway Traffic Safety Administration’s National Center for Statistics and Analysis. 2009. Traffic Safety Facts: 2008 Overview. • Surface Transportation Policy Project. 2004. Aging Americans: Stranded Without Options. • Ashmead, D.H., et al. 2005. Street Crossing by Sighted and Blind Pedestrians at a Modern Roundabout. Journal of Transportation Engineering, 131 (11): 812-821. • Bay Area Air Quality Management District. 2007. Source Inventory of Greenhouse Gas Emissions. • Pucher, J. 2009. Walking and Cycling: Path to Improved Public Health. Fit City Conference, NYC. • National Association for Sport and Physical Education. 2010. Shape of the Nation Report.