Seismic Reflections and Ground Acceleration Analysis during the August 23, 2011 Earthquake
This report examines the seismic reflections along I-64 and the ground acceleration recorded at the North Anna Power Station during the earthquake on August 23, 2011. The study highlights peak ground acceleration reaching 0.26 g, signifying significant shaking effects. It discusses historical predictions regarding maximum horizontal ground acceleration and documents shaking intensity across Virginia, detailing the distance from the epicenter. Relevant data from different sources, including graphs by Martin Chapman and USGS analyses, provide insights into seismic activity and its implications for public safety.

Seismic Reflections and Ground Acceleration Analysis during the August 23, 2011 Earthquake
E N D
Presentation Transcript
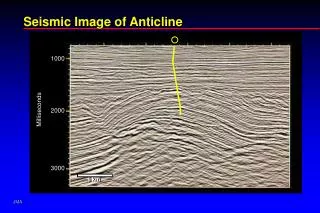
Seismic Reflection Image along I-64 Pratt et al., 1988 Coruh et al., 1988
Ground acceleration at the North Anna Power Station during the August 23rd 2011 earthquake Graph by Martin Chapman, Va Tech
Ground acceleration at the North Anna Power Station during the August 23rd 2011 earthquake Peak ground acceleration 260 cm-2 or 0.26 g or 26% of gravity 1971 Report for VEPCO “that the maximum horizontal ground acceleration… at the site due to such a shock would be no more than 12% of gravity” Graph by Martin Chapman, Va Tech
Shaking in Virginia shaking too strong for instrument 55 km from epicenter 127 km from epicenter 193 km from epicenter 231 km from epicenter time (seconds) VTSO
Shaking Across USA C. Bailey & U. South Carolina
Felt Shaking USGS
National Earthquake Hazard Map Epicenter, August 23 Mainshock USGS
Aftershocks at Depth slice along N120˚E R. Herrmann
Louisa County VA DMME photos