Download
1 / 18
190 likes | 459 Vues
Vehicle Efficiency Improvement Design Fuel Consumption vs. Design Fuel Economy. Transportation Work Group Phase III - Meeting 1 October 30, 2003 . Meszler Engineering Services 906 Hamburg Drive Abingdon, Maryland 21009. 410-569-0599 www.meszler.com. Sound Design is Essential to Success.

E N D
Vehicle Efficiency ImprovementDesign Fuel Consumption vs. Design Fuel Economy Transportation Work Group Phase III - Meeting 1 October 30, 2003 Meszler Engineering Services 906 Hamburg Drive Abingdon, Maryland 21009 410-569-0599 www.meszler.com
Sound Design is Essential to Success • Theory -- promote GHG reduction through penalty/reward. • Previous fee/reward structures based on EPA fuel economy (FE). • Although GHG goes down as FE goes up (and vice versa), changes are not proportional. • GHG changes are proportional to fuel consumption (FC) changes. Page 2
Design (EPA) FE vs. Design (EPA) FC • Basic Relationships: • FE = miles per gallon (mpg) as published by EPA. • FC = gallons per mile (as derived from EPA FE). • FC = 1 / FE ----- and ----- FE = 1 / FC • If one is just a restatement of the other, does it really make any difference? • It absolutely does, as shown in the following slides. Page 3
Discussion Clarification (a) • Throughout this discussion fuel consumption means the design fuel consumption rate equivalent to the design fuel economy values published by EPA. • FC is not intended to capture differences in annual gasoline use due to different mileage accumulation rates. Page 4
Discussion Clarification (b) • Vehicles may accumulate mileage at different rates, but lifetime mileage will be similar. • A 50,000 miles/year vehicle will be gone in 2-3 years. • A 10,000 miles/year vehicle will be around for 12-15 years. • The total emissions load will be similar for both (ignoring other differences like maintenance habits). • High VMT drivers will be subject to fee/rebate more often as their vehicles “consume” their lives quicker. Page 5
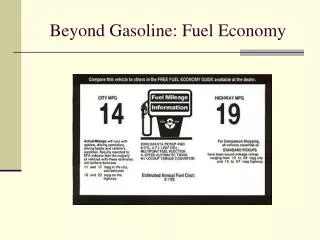
Fuel Economy or Fuel Consumptionmpg or gallons/mile -- What Difference Does it Make? 10 mpg to 20 mpg: FE increases by 10 mpg - FC decreases by 5 gals/100 miles. 20 mpg to 40 mpg: FE increases by 20 mpg - FC decreases by 2.5 gals/100 miles. 40 mpg to 80 mpg: FE increases by 40 mpg - FC decreases by 1.25 gals/100 miles. Page 6
Fuel Economy or Fuel ConsumptionPractical Difference Under FE-based design 13 mpg vehicle pays $3000 for consuming 3.1 gal/100 mi more fuel than a 22 mpg vehicle. 37 mpg vehicle gets $3000 for consuming 1.8 gal/100 mi less. Reduction is “worth more” than increase. From an “equal value” perspective, a 72 mpg vehicle would consume 3.1 gal/100 mi less. Page 7
Additional Detail and Expanded Explanations of Technical Issues Page 8
Fuel Economy or Fuel Consumption • Question: What difference does it make, aren’t they the same thing? • Answer: No. They are related, but not in a linear fashion. Thus, a change in one does not induce an equal change in the other. Direct GHG insights can only be gained through fuel consumption. • Why: Because CO2 emissions are directly and linearly related to fuel consumption. Page 9
FE vs. FC - Example Illustration (a) • Take 2 vehicles with fuel economy (FE) values of 15 and 45 mpg. This is often interpreted as implying an “expected” average mpg of 30. • Balance is presumed because the 15 mpg vehicle gets 50% worse than expected FE, while the 45 mpg vehicle gets 50% better than expected FE. • However, actual average FE is not 30 mpg, and average CO2 is not that of a 30 mpg vehicle. Page 10
FE vs. FC - Example Illustration (b) • 30 mpg is the average FE only in a restricted case where fuel is rationed equally across vehicles. • E.g., each vehicle is allotted 5K gallons of fuel over its lifetime. At 15 mpg, vehicle 1 can travel 75K miles, while at 45 mpg, vehicle 2 goes 225K miles. Together, 300K miles are traveled on 10K gallons of fuel for a net FE of 30 mpg. • However, in reality each vehicle has a similar lifetime mileage and uses fuel accordingly. Page 11
FE vs. FC - Example Illustration (c) • E.g., each vehicle travels 150K miles over its lifetime. At 15 mpg, vehicle 1 uses 10K gallons, while at 45 mpg, vehicle 2 uses 3.3K gallons. Like before, 300K miles are traveled, but on 13.3K gallons of fuel (instead of 10K), for a net FE of 22.5 mpg. • Since fuel consumption (FC) increases with the inverse of FE (1/FE), average FC is biased toward lower FE. Page 12
FE vs. FC - Example Illustration (d) • At 22.5 mpg, average fuel consumption is 6666.7 gallons per lifetime (or 0.0444 gal/mi). • At 15 mpg, vehicle 1 uses 50% more fuel (0.0666 gal/mi) and produces 50% more CO2. • At 45 mpg, vehicle 2 uses 50% less fuel (0.0222 gal/mi) and produces 50% less CO2. • Even though vehicle 1’s FE is “only” 33% worse than average while vehicle 2’s FE is 100% better! Page 13
FE vs. FC - Example Illustration (e) • Conversely, if we run the calculations using an average FE of 30 mpg, vehicles 1 and 2 are 50% worse and 50% better respectively in terms of FE, but their CO2 emissions do not vary equally. • At 30 mpg, average fuel consumption is 0.0333 gal/mi), so the 15 mpg vehicle produces 100% more CO2 while the 45 mpg vehicle produces “only” 33 percent less. Page 14
FE vs. FC - Example Illustration (f) • Conclusion: If the penalty/reward structure of an efficiency program is intended to accurately reflect GHG performance, it must be based on FC. • Of course, fees can be assigned to specific FE values, but all underlying calculations must be performed in FC “space.” Page 15
2003 FE by Class (National Data) Data include automatic transmission vehicles only, manual transmission versions with 3-5 percent lower fuel consumption are available for many models. Page 16
2003 FC by Class (National Data) Data include automatic transmission vehicles only, manual transmission versions with 3-5 percent lower fuel consumption are available for many models. Page 17
2003 CO2 by Class (National Data) Data include automatic transmission vehicles only, manual transmission versions with 3-5 percent lower fuel consumption are available for many models. Page 18