Download
1 / 26
270 likes | 298 Vues
Quality Control Standards for SEADATANET. OUTLINE OF QUALITY CONTROL DOCUMENT Introduction Why is quality control is needed? Information to accompany data Automatic checks “Scientific” quality control CTD (temperature and salinity) Current meter data (including ADCP) Wave data Sea level

E N D
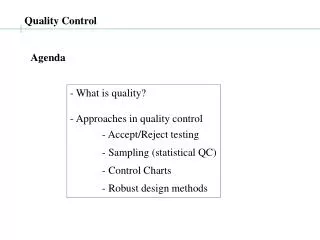
Quality Control Standards for SEADATANET • OUTLINE OF QUALITY CONTROL DOCUMENT • Introduction • Why is quality control is needed? • Information to accompany data • Automatic checks • “Scientific” quality control • CTD (temperature and salinity) • Current meter data (including ADCP) • Wave data • Sea level • Biological data, etc., • Quality flags • Documentation
Quality Control Standards for SEADATANET • Data quality control has the following objective: • “To ensure the data consistency within a single data set and within a collection of data sets and to ensure that the quality and errors of the data are apparent to the user who has sufficient information to assess its suitability for a task.” (IOC/CEC Manual, 1993) • Quality control, if done well, brings about a number of key advantages: • Maintaining standards • Consistency • Reliability
Quality Control Standards for SEADATANET • For all types of data information is required about: • Where the data were collected: location (preferably as latitude and longitude) and depth/height • When the data were collected (date and time in UTC or clearly specified local time zone) • How the data were collected (e.g. sampling methods, instrument types, analytical techniques) • How the data are referenced (e.g. station numbers, cast numbers) • Who collected the data, including name and institution of the data originator(s) and the principal investigator • What has been done to the data (e.g. details of processing and calibrations applied, algorithms used to compute derived parameters) • Comments for other users of the data (e.g. problems encountered and comments on data quality)
Data Collection Details: example 1 • Biological Net Tow (Plankton) • Project, ship, cruise identifier • Country, organisation • Date, time, latitude and longitude (for start and end if sampling via a net tow) • Sounding, maximum and minimum pressure or depth of tow • Description of operational procedures such as tow orientation (vertical, horizontal or oblique), methods of position fixing (e.g. DGPS, GPS, etc.) • Weather conditions (including sun and wind) • Gear type (e.g. net mesh size, net mouth size, single or multi-net, etc.) • Sample preservation method (e.g. pickling, frozen, etc.) • Sample analysis/processing or data collection procedures (e.g. filtered size ranges, sub-sampling, etc.) • Any additional information of use to secondary users which may have affected the data or have a bearing on its subsequent use
Data Collection Details: example 2 • Shipboard ADCP • Project, ship, cruise identifier • Country, organisation • Details of the instrument and sensors (e.g. manufacturer, instrument type, model number, serial number and any modifications carried out, number of transducers) • Description of operational procedures including sampling interval (time between ensembles), pings per ensemble, bin size, number of bins, bottom tracking on/off, pitch and roll on/off, percentage good level, method of position fix (e.g. GPS, DGPS), automated data rejection (e.g. fish rejection algorithms), etc. • Frequency (kHz), band type (broad, narrow) • Date and time of the start and end of the profiles for each data file • Any additional information of use to secondary users which may have affected the data or have a bearing on its subsequent use.
Quality Control Standards for SEADATANET • Parameter Details • Parameters measured • (Refer to BODC Parameter Usage Vocabulary if necessary for help with parameter definitions) • Data Processing Details • Originator's Data Format • Description of calibrations • Description of any data processing that has occurred (manufacturers and in-house)
Basic automatic checks for all data types • Date and timeof an observation has to be valid • Year 4 digits • Month between 1 and 12 • Day in range expected for month • Hour between 0 and 23 • Minute between 0 and 59 • Latitude and longitudehave to be valid • Latitude in range -90 to 90 • Longitude in range -180 to 180 • Position must not be on land • Observation latitude and longitude located in ocean • For example, use 5-minute bathymetry (e.g. ETOPO5)
Further automatic checks • Impossible speed • Tests for acceptable speed between stations • Spike • Tests salinity and temperature data for large differences between adjacent values(other parameters also) • Gradient • Tests for gradient between vertically adjacent salinity and temperature measurements too steep • Density inversion • Tests where calculated density at a higher pressure in a profile is less than the calculated density at an adjacent lower pressure • Pressure increasing • Pressures from the profile monotonically increasing
Further automatic checks • Global range • Tests that observed temperature and salinity values are within the expected extremes encountered in the oceans • Regional range • Tests that observed temperature and salinity values are within the expected extremes encountered in particular regions • Deepest pressure • Tests that profile does not contain pressures higher than the highest value expected • Check for duplicates • Cruises or stations within a cruise using a space-time radius (e.g., for duplicate cruises: 1 mile, 15min or 1day if time is unknown)
Quality Control Standards for SEADATANET • Visual inspection of data • Pressure/depth series (e.g. CTD) • Property-property plot • Time series (e.g. current meter, sea level) • Scatter plot (e.g. current meter) • Map covering the locations of series • Ensure that data are free from instrument-generated spikes, gaps, spurious data at the start and end of the record and other irregularities • Apply quality flags • Quality flags do not change the data • Visual inspection can be subjective, dependent on experience
Quality Control Standards for SEADATANET • Spikedetection • Can require visual inspection to back up automatic check • Range check • Comparison with pre-existing climatological statistics • Compare data collected on same cruise and in same area
Quality Control Standards for SEADATANET Example of a current meter time series with a possible rotor problem (Current Speed (ms-1), North velocity component (ms-1), East velocity component (ms-1), Current Direction (°), Temperature (°C) (not shown))
Quality Control Standards for SEADATANET BELOW: example of a record with suspect directions ABOVE: example of a ‘good’ scatter plot
Quality Control Standards for SEADATANET • Common Problems Associated with Current Meters (1) • Rotor turns, but there is either a breakdown of magnetic coupling between the rotor and follower or reed switch which then fails to register rotations • Rotor not turning due to fouling with weed or the suchlike. This results in a sudden drop in speed to zero or near zero. • Directions not being resolved. This could result from a stiff meter suspension or a meter being fouled by its mooring wire. • Compass sticking. This may occur if the meter is inclined too far from the horizontal plane and can be a problem in fast tidal streams when in-line instruments are used. This is commonly known as .mooring-knockdown’. This is seen in the data as a frequent recurrence of a single direction value or a narrow range of directions. • Worn compass. This causes some directions to become repetitive.
Quality Control Standards for SEADATANET • Common Problems Associated with Current Meters (2) • Non linearity of compass. This is usually picked up from the scatter plot of u and v velocity components. • Sticking encoder pins. This causes spikes in all parameters and is often manifested by the appearance of the value of the pin(s) in the listing (e.g. 0, 256, 512, 768 or 1023). • Underrated power supply. This often shows in the compass channel first because of the extra current drain during clamping. • Electronic failure (e.g. dry joints, circuitry broken). This does not always produce a total loss of data however. • Poor quality recording tape. This is indicated by the appearance of suspect data at regular intervals in all parameters. • Sensor drift. This is a slow change in the response of the sensor.
Quality Control Standards for SEADATANET Scatter plot of wave height against (zero up-crossing or crest) period Wave heights (maximum in pink; significant in blue) are ok for range, basically normal distribution, steepness (all < 5%)
Quality Control Standards for SEADATANET • 1-Dimensional and Directional Wave Spectra • Check slope of energy density spectrum – should follow a set slope due to transfer of energy from lower to higher frequencies (?) • Check that energy in the spectrum at frequencies below 0.04 Hz is not more than 5% of the total spectral energy • Check that energy in the spectrum at frequencies above 0.6 Hz is not more than 5% of the total spectral energy • Check mean direction at high frequencies, which should correspond to the wind direction (assuming coincident meteorological data). • For 1D spectra, calculate zeroth spectral moment from spectral variance densities and check that it corresponds to the given value • For 1D spectra, calculate Te as the zeroth divided by first negative spectral moment and check that it correlates with (peak or zero upcrossing) period
Quality Control Standards for SEADATANET • Sea Level Data • Harmonic analysis - generate predictions • Calculate residuals • Spikes • Constant values • Clock malfunctions • Gap filling • Reference changes • Calculation of statistics
Biological data quality control • COPEPOD: A Global Plankton Database (2005) • Plankton data are variable by nature, influenced by numerous physical and biological events. • Unlike temperature or salinity values, no tight range of typical values that one can use to easily qualify or disqualify these data. • Plankton values greatly affected by size of net mesh and depth of tow. • Very basic value range and statistical techniques to look for anomalous or non-representative data. • The variety of original units still do not allow for easy inter-comparison of the data: Common Baseunit Value (CBV) was calculated • Biological Grouping Code (BGC) identifies the plankton taxa’s membership in up to four groupings
Biological data – range checks • CBV and BGC are used together to perform broad, taxonomic group-based value range checks • A single range (for the entire world ocean) was used for the major and minor taxonomic groups. • Future work will divide these ranges into smaller taxonomic sub-groups and individual oceanographic basins or regions, allowing for tighter range checks • Value ranges very general and encompass the effects of: • Different mesh sizes • Day versus night sampling • Presence of smaller life stages (“number of adults” vs. “number of adults + juveniles”) • Will be adjusted as new data and better techniques added to database • New ranges, as well as ranges for additional plankton sub-groups will be available online.
Biological data - statistical checks • Used to search for questionable values • Not used to automatically flag values • For each BGC group mean and standard deviation calculated based on all observations present in database • Individual observations >5 standard deviations from mean investigated on a case by-case basis • Natural variability may account for many “outliers”, method helped identify extreme values caused by misinterpreted units or typographic errors • In many cases, values off by a factor of 1000 • Readily detected by these simple statistical checks
SeaDataNet quality control flags • Flag Short description • 0 No quality control • 1 The value appears to be correct • 2 The value appears to be probably good • 3 The value appears probably bad • 4 The value appears erroneous • 5 The value has been changed • 6 Below detection limit • 7 In excess of quoted value • 8 Interpolated value • 9 Missing value • A Incomplete information • Based on IGOSS/UOT/GTSPP & Argo quality flags
Quality Control Standards for SEADATANET • Data Documentation • Comprehensive documentation to accompany the data • All data sets need to be fully documented to ensure they can be used in the future without ambiguity or uncertainty • Compiled using: • information supplied by the data originator (e.g. data reports, comments on data quality) • any further information gained during QC • Includes:instrument details, mooring details, data quality, calibration and processing carried out by the data originator and data centre processing and quality control
Quality Control Standards for SEADATANET • REFERENCES • NODC procedures (e.g. France, Greece, Italy, Norway, Spain, Sweden, UK) • EU MEDAR-MEDATLAS procedures and SCOOP software • EU SIMORC project (Met-ocean data QC) • EU ESEAS (sea level) and IOC GLOSS documents • Manual of Quality Control Procedures for Validation of Oceanographic Data, UNESCO, IOC - Manuals & Guides, 1993, Manual And Guides 26 • GTSPP QC (IOC Manuals and Guides No. 22) • Argo Quality Control Manual (Real Time and Delayed Mode) • GOSUD Real-time quality control • IODE’s OceanTeacher • ICES WG Marine Data Management Data Type Guidelines • JPOTS Manual, 1991 • WOCE manuals • JGOFS Protocols • World Ocean Database Quality Control documentation • TOGA/COARE Handbook of Quality Control Procedures for Surface Meteorology Data • BODC-WOCE Sea Level Data Assembly Centre Quality Assessment • AODC Quality Control Cookbook for XBT Data • Chapman, A. D. 2005. Principles and Methods of Data Cleaning – Primary Species and Species-Occurrence Data, version 1.0. • Chapman, A. D. 2005. Principles of Data Quality, version 1.0. Report for the Global Biodiversity Information Facility, Copenhagen. • ‘Ocean biodiversity informatics’: a new era in marine biology research and management (Mark J. Costello, Edward Vanden Berghe) • QARTOD (Quality Assurance of Real-Time Oceanographic Data)