Download
1 / 21
210 likes | 230 Vues
This paper proposes an ARM technique for analyzing and discovering relationships in Saccharomyces cerevisiae (Yeast) genomic data that scales to larger datasets. It optimizes the rule-discovery process, reduces the number of overwhelming rules, and operates in an incremental and interactive mode.

E N D
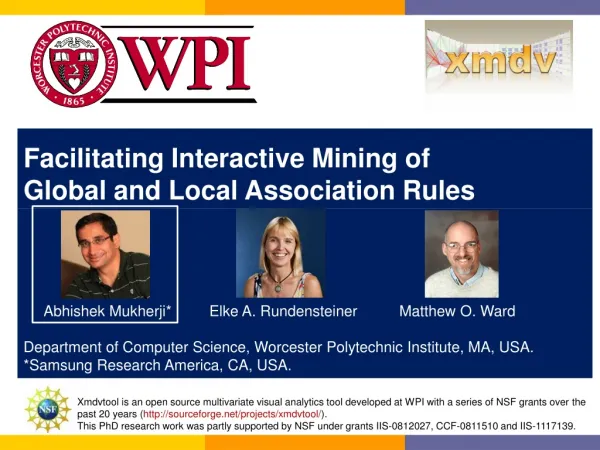
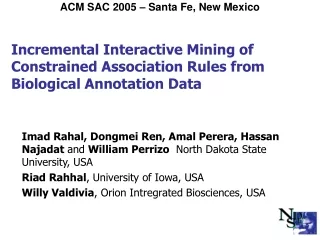
Incremental Interactive Mining of Constrained Association Rules from Biological Annotation Data Imad Rahal, Dongmei Ren, Amal Perera, Hassan Najadat and William Perrizo North Dakota State University, USA Riad Rahhal, University of Iowa, USA Willy Valdivia, Orion Intregrated Biosciences, USA
High throughput techniques are producing massive quatities of boiinformatics data • Consequently, there is a need for analysis methodologies that scale to larger and larger datasets. • In this paper we us Association rule mining (ARM) to discover relationships in Saccharomyces cerevisiae (Yeast) genomic data. • ARM was 1st proposed for Market Basket Research (MBR) • ARM comes into its own when much of the data is categorical or where there are a very large number of dimensions. • However, ARM has been noted for producing a large number of rules, which can overwhelm researchers • Frequent itemset mining (1st step in ARM) also provides indexing for attributes that appear often, for faster access to information.
We propose a new ARM technique which • Optimizes the rule-discovery process by giving biologists the flexibility of incorporating their knowledge into it, • Reduces the overwhelming number of rules that match the specified minimum support and confidence thresholds, • Operates in an incremental and interactive mode, Allows new queries to be posed from old ones; interactive mining Uses previous results to answer new queries; incremental mining • Stores and processes data vertically
Data Representation • Data used was extracted mostly from the MIPS database (Munich Information center for Protein Sequences) • Left column shows all considered features (feature groups) • Right column shows the number of distinct feature values in the extent domain of each feature
Data Representation • We built a Binary gene-by-feature table. • For a categorical feature, we consider each category as a separate attribute or column by bit-mapping it. • For numeric attributes and hierarchical categorical attributes, we used a bit vector for each bit position or hierarchy level (reducing the number of bit vectors by ~ log(n) • The resulting table has a total of • 8039 distinct feature bit vectors (corresponding to “items” in MBR) for • 6374 yeast genes (corresponding to transactions in MBR) • For processing and storage optimization, we use Predicate tree (P-tree) patent pending technology to vertically store and process the resulting bit vectors
Predicate tree technology: vertically project each attribute, Current practice: Structure data into horizontal records. Process vertically (scans) R[A1] R[A2] R[A3] R[A4] 010 111 110 001 011 111 110 000 010 110 101 001 010 111 101 111 101 010 001 100 010 010 001 101 111 000 001 100 111 000 001 100 010 111 110 001 011 111 110 000 010 110 101 001 010 111 101 111 101 010 001 100 010 010 001 101 111 000 001 100 111 000 001 100 Horizontally structured records Scanned vertically = pure1? true=1 pure1? false=0 R11 R12 R13 R21 R22 R23 R31 R32 R33 R41 R42 R43 0 1 0 1 1 1 1 1 0 0 0 1 0 1 1 1 1 1 1 1 0 0 0 0 0 1 0 1 1 0 1 0 1 0 0 1 0 1 0 1 1 1 1 0 1 1 1 1 1 0 1 0 1 0 0 0 1 1 0 0 0 1 0 0 1 0 0 0 1 1 0 1 1 1 1 0 0 0 0 0 1 1 0 0 1 1 1 0 0 0 0 0 1 1 0 0 pure1? false=0 pure1? false=0 pure1? false=0 0 0 0 1 0 01 0 1 0 1 0 0 1 0 0 1 01 1. Whole is pure1? false 0 P11 P12 P13 P21 P22 P23 P31 P32 P33 P41 P42 P43 2. Left half pure1? false 0 P11 0 0 0 0 1 01 3. Right half pure1? false 0 0 0 0 0 1 0 0 10 01 0 0 0 1 0 0 0 0 0 0 0 1 01 10 0 0 0 0 1 10 0 0 0 0 1 10 0 0 0 0 1 10 0 0 0 0 0 0 0 0 0 0 0 0 0 1 0 0 0 0 1 1 0 1 0 0 ^ ^ ^ ^ ^ ^ ^ ^ ^ 0 0 1 0 1 4. Left half of rt half? false0 ^ 0 0 1 0 1 01 5. Rt half of right half? true1 0 1 0 6. Lf half of lf of rt? true1 7. Rt half of lf of rt? false0 then vertically project each bit position of each attribute, then compress each bit slice into a basic Ptree. e.g., compression of R11 into P11 goes as follows: Base 2 Base 10 R(A1 A2 A3 A4) 2 7 6 1 6 7 6 0 2 7 5 1 2 7 5 7 5 2 1 4 2 2 1 5 7 0 1 4 7 0 1 4 R11 0 0 0 0 1 0 1 1 Top-down construction of the 1-dimensional Ptree representation of R11, denoted, P11, is built by recording the truth of the universal predicate “pure 1” in a tree recursively on halves (1/21 subsets), until purity is achieved. Horizontally AND basic Ptrees P11 And it’s pure so branch ends But it is pure (pure0) so this branch ends For categorical attributes, a bitmap is formed for each category then compressed into a P-tree.
R11 0 0 0 0 1 0 1 1 Top-down construction of basic P-trees is best for understanding, but bottom-up is much more efficient. 0 0 1 1 1 1 1 1 0 0 1 1 1 1 1 0 0 0 1 1 1 1 1 1 0 0 1 1 1 1 1 1 1 0 1 1 1 1 0 0 0 0 1 1 1 1 0 0 0 0 1 1 1 1 0 0 0 0 0 1 1 1 0 0 0 0 1 1 0 0 0 0 0 0 0 0 0 0 1 1 0 0 1 1 1 1 0 0 1 1 0 0 0 0 1 0 0 0 0 0 1 1 1 1 1 1 0 0 0 0 0 0 1 1 0 0 1 1 1 1 0 0 1 1 0 1 1 1 bottom up construction of2-Dimensional Ptrees(eg, natural dim choice for images) Bottom-up construction of 1-Dim, P11, is done using in-order tree traversal and the collapsing of pure siblings, as follow: P11 R11 R12 R13 R21 R22 R23 R31 R32 R33 R41 R42 R43 0 1 0 1 1 1 1 1 0 0 0 1 0 1 1 1 1 1 1 1 0 0 0 0 0 1 0 1 1 0 1 0 1 0 0 1 0 1 0 1 1 1 1 0 1 1 1 1 1 0 1 0 1 0 0 0 1 1 0 0 0 1 0 0 1 0 0 0 1 1 0 1 1 1 1 0 0 0 0 0 1 1 0 0 1 1 1 0 0 0 0 0 1 1 0 0 0 bit-file (e.g., hi-order bit of Green band): 1111110011111000111111001111111011110000111100001111000001110000 Which, in spatial raster order is: Ptree using 2-Dim Peano order.
Mining The Yeast Genome • A scientist interested in investigating the effect of one subset of the features over another, such as the effect of phenotype on function would • Mine the frequent itemsets from the phenotype and function feature values separately (produce two independent sets of frequent itemsets) • Perform a join on the two sets of frequent itemsets and produce a new set containing all frequent itemsets combining the two features • We assume the antecedent is to come from one feature set and the consequent from the other, thus, each frequent itemset will produce at most one rule (if the confidence of that rule is high enough). • All subsequent queries that include phenotype and/or function would benefit from the frequent itemset mining already done.
The Mining Algorithm • Input: • Rule query • minisupp and miniconf • Step 1: Mining of FISs from Individual Features Relevant feature F, mine all frequent itemsets from F-values separately • Using P-trees: Support of an itemset containing items F1 and F2 is just PF1 and PF2 • Perfom the ROOTCOUNT operation on the result • Because of the independent treatment of the feature, mining them involved is done in parallel • Step 2:Joining of Feature FISs • After separately mining all the frequent itemsets from the items of all selected features, we perform a join step
The Mining Algorithm Exploits down closure property of support with respect to itemset size • any itemset must have support greater than or equal to the support of any of its supersets and thus no itemset can be frequent unless all of its subsets are also frequent E.g., phenotypefunction: If the join of two frequent itemsets Iphenotype and Ifunctionis a non-frequent itemset then there is no need to join Iphenotypeor any of its supersets with Ifunction or any of its supersets
The Mining Algorithm • Step 3: Producing Strong Rules • No enumeration of different rules that could be derived from a frequent itemset is needed (second step in traditional ARM) • Note: computing the confidence of a rule is also efficient using P-trees: confidence of a rule AC is ROOTCOUNT(PAC) /ROOTCOUNT (PA) • Step 4: After the user examines the returned rules, s/he often wishes to issue a related but slightly different query. • This can be viewed as the start of the interactive mode • Such new queries typically involve features that have already been included in previous query. • Our approach would incrementally build on the results obtained so far to answer the new query
The Mining Algorithm • For example, suppose that the user submits: “localizationfunction” after “phenotype function” , all that needs to be done is to mine frequent itemsets from localization and join them with function • If a new query, “localization, phenotypefunction”, is submitted, we utilize the all frequent itemsets from the first request and join them those derived from localization.
Ø Cell cycle defects Stress response defects Sensitivity to antibiotics Cell cycle defects Stress response defects Transcription a) Ø Metabolism Energy Metabolism b) Algorithmic Details • For the generationof FISs,we utilize a previous P-tree ARM approach [Rahal, Denton, Perrizo JIKM Journal Dec. 2004 [13] and store them in a (frequent) Set Enumeration (SE) tree containing all frequent itemsets • a) example (frequent) SE for function • b) example (frequent) SE for phenotype
Experimental Study • Implementations coded in C++ and executed on an Intel Pentium-4 2.4GHz processor workstation, 2GB RAM, Redhat Linux 9.0. All implementations use P-tree API http://midas.cs.ndsu.nodak.edu/~datasurg/ptree • For our approach, we computed the total time for executing 5, 10, 15, 20 and 25 consecutive inter-related queries • Each query contains up to 3 features and uses at least one feature from a previous query • We compare with the standard approach (mine over all attribute values) • we only include the time needed to mine the whole dataset without the time needed to scan the resulting set of rules for the subset of interest • We set the min. conf. threshold to 90% and varied the min. supp. threshold between 0.05% and 20%
The figure clearly shows the gain achieved by using our approach • The post-processing approach needs more than 620 seconds at 5.9% support threshold
Biologists could go to very low support thresholds and mine frequent itemsets (and eventually rules) that would go undetected in the post-processing approach
The brute-force approach returned slightly less than a million rules at support 5.9% most of which are irrelevant to the queries we’ve selected • For our queries, interesting rules started to show up at support ~ 0.5% • For high support, mostly uninteresting & evident (trivial) rules appeared • Here is where our results associated the yeast eIF2B factor with specific interactions within the cellular complex.
A significant portion of the rules were straight forward in the sense of providing only common knowledge, e.g., complex=cytoplasmic ribosomal large subunit localization=cytoplasm • Of significant interest to our biological colaborators was a set of rules pertinent to the yeast eukaryotic initiation factor 2B (eIF2B) • “complex = eIF2B (5 ORFs)”“function = ribosome biogenesis” • A multi-sub-unit guanine nucleotide exchange factor which catalyzes the exchange of GDP bound to initiation factor eIF2 for GTP, generating active eIF2-GTP. In humans, it is composed of five subunits, alpha, beta, delta, gamma and epsilon • In yeast, the eIF2Bfactor mediates the exchange of a series of proteins bound to translation initiation, the process preceding formation of the peptide bond between the first two amino acids of a protein. • In specific, it catalyzes a vital regulatory step in the initiation of the translation of mRNA
YOUR DATA MINING YOUR DATA Data Integration Language DIL Ptree (Predicates) Query Language PQL DII (Data Integration Interface) DMI (Data Mining Interface) Data Repository lossless, compressed, distributed, vertically-structured database Architecture for the DataMIME™ System(DataMIMEtm data mining, NO NOISE) http://www.cs.ndsu.nodak.edu/~datamine Internet
Conclusion • In this paper, we proposed a computational approach targeted at the analysis of the yeast genome annotation data • It gives biologists the flexibility of incorporating domain knowledge, in the form of queries, thus aiding in focusing their analysis on specific features of interest. • It optimizes the rule-discovery process by allowing operation in the interactive and incremental modes and enables • parallel processing • reuse of mined results • Vertical, efficient storage and processing
Future Directions • Extend the features in our analyzed data such as to include secondary protein structure information • We also aim to pursue similar analysis over different genomes such as the human genome • A broader goal is to look for “inter-organism” association rules valid across organisms rather than on a single organism