PRI Scores in Stress Research: Models, Coping, and Findings
410 likes | 445 Vues
Explore various stress models (Selye, Holmes & Rahe, Hobfoll, Lazarus & Folkman) in PRI scores research. Understand coping strategies, response theories, and findings on teacher stress. Learn the importance of measuring stress and identifying coping strengths and weaknesses.

PRI Scores in Stress Research: Models, Coping, and Findings
E N D
Presentation Transcript
Understanding PRI Scores RSCH 6109
Overview Review of Stress Theory Review of Coping Theory PRI Scores Teacher Stress Research Findings
What is Stress? What is Coping? Response models (Selye) Stimulus models (Holmes & Rahe) Conservation of resources model (Hobfoll) Transactional models (Lazarus & Folkman)
Selye Model Oldest model Originated the concept of stress Physiological response The non-specific response of the body to demands Autonomic nervous system Why is this model limited?
Selye Model Overly simplified Ignores the cognitive component Reactive, Ignores prevention Coping limited to: Diet, Exercise, Meditation, Yoga Tension Control
Holmes & Rahe Model Focuses on negative life events Assumes that stress increases as the number of significant changes or negative stimuli increases Why is this model limited?
Holmes & Rahe Model Overly simplified Ignores the cognitive component Focuses on demands, or stimuli, but not reactions to them Coping limited to: Adaptation to change
Hobfoll Model Includes personal and external resources the individual can harness to combat stress Perceived control Stress comes from loss of resources Why is this limited?
Hobfoll Model Research base focuses on people who have had large losses Ignores daily hassles Resources can remain constant while demands increase
Transactional Models of Stress(Lazarus and Folkman) Stress results from perceptions of inequality between resources and demands Appraisals of resources and demands mediate the stress response
Attribution Theory Perceptions are central to the stress response Our thoughts about negative life events, demands, and changes impact our perceptions of resources and demands
Attribution Theory Healthy Unhealthy Low Stress High stress Internal External Specific Global Unstable Stable
Expanded Transactional Model Preventive Resources Combative Resources Emotion-Focused Coping Problem-Focused Coping
Review Models Response models (Selye) Stimulus models (Holmes & Rahe) Conservation of resources model (Hobfoll) Transactional models (Lazarus & Folkman)
Review – What is Stress? Coping? Stress is the perceived inequality between resources and demands The stress response is a physiological response to sustained stress Coping involves strategies used to prevent and combat stress
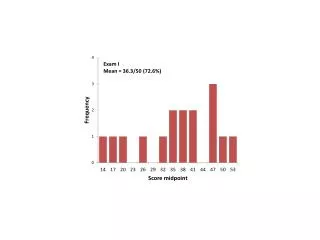
Understanding PRI Scores T Scores Mean = 50, SD = 10 40-60 = Expected or “normal” range T Scores reflect relative position in the population Norm sample = 1,366
Understanding PRI Scores T Scores < 40 are considered low, suggest an area for growth T Scores > 60 are considered high, suggest an area of strength Why is it important to help the client identify relative strengths and weakness in coping skills?
Understanding PRI Scores All test scores have some error in them The reliability of a set of scores helps us understand how much error they contain The Standard Error of Measurement helps us estimate how much error there is in a particular test score
Understanding PRI Scores SEM = σ2X√ (1 - rxx’ ) The expected amount of error in a test score is like the difference between the true score and the observed score
Understanding PRI Scores We can use the SEM to interpret test scores in terms of “True” scores by creating confidence intervals Observed score +/- 1.96 * SEM
Understanding PRI Scores We are 95% confident that the client’s true score on the Perceived Control scale falls in the interval from 45 to 57
Current Strategies for Measuring Stress Negative Life Events Burnout Physiological Symptoms Psychological Symptoms Situational Demands Daily Hassles Demotivation
ClassroomAppraisalofResources and Demands Preschool Version (PS) School-aged Version (SA) Difference Score Resources - Demands
Theory Supporting the Classroom Appraisal of Resources and Demands Context-specific Appraisal of Demands Context-specific Appraisal of Resources Global Efficacy Task-specific Efficacy
Grouping Teachers by Risk for Stress Classified Teachers into 3 groups: PS SA R>D 34.4% 30.9% R=D 35.0% 34.9% D>R 30.6% 34.2%
Group Differences Mean Number of Children in Classroom with Behavior Problems PS SA R>D 1.97 2.97 R=D 2.35 2.80 D>R 3.69 4.23
SA Group Differences Percentage of Classrooms with At Least One LD Child Mean R>D 80.0% 3.66 R=D 96.1% 3.36 D>R 98.0% 4.65
Research Findings No statistically significant differences except for the reported number of children with behavior problems and LD Low risk of stress groups rated innovations as more effective
Research Findings The relationship of teacher quality to student achievement seems to moderated by the concentration of special needs children in the classroom
Implications How are children assigned to classrooms? Concentration of disruptive and LD children in inclusive classrooms Counselors can help enhance teacher self-efficacy and stress prevention skills