Download
1 / 25
280 likes | 651 Vues
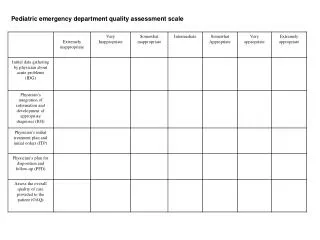
Assessment in emergency. The best analogy is clinical medicine. Qualitative (history and examination) and quantitative (measurements and laboratory) data are combined. These form a recognisable pattern to make a diagnosis and allow the severity of the situation to be assessed.

E N D
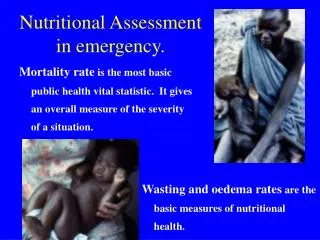
Assessment in emergency. The best analogy is clinical medicine. Qualitative (history and examination) and quantitative (measurements and laboratory) data are combined. These form a recognisable pattern to make a diagnosis and allow the severity of the situation to be assessed. A treatment plan is then formulated, implemented and progress followed. We do the same in any emergency. For a population in an emergency we need to recognise the pattern of problems, make the “diagnosis”, assess the severity and implement the relief (treatment). Wasting, oedema and mortality rates are critical measures of the severity of the insult, and the urgency of intervention. But usually only show whether the “diagnosis” is of a serious or not-so-serious nature.
Wasting rates (WFH) Oedema rates CMR U5MR Essential Population size Demography Stunting Micronutrient deficiency Breast feeding Food security/economy Infection/vaccination Contextual data Quantitative Information
What can wasting/oedema rates tell us? • Wasting - problem with: • Diet quality - Type 2 nutrients (protein, K, Na, Mg, Zn, P, S) • Total food availability (Low quantity nearly always means lack of diversity and low diet quality as well) • disease (relatively small effect) • Oedema - problem with: • Diet quality - Type 1 nutrients (antioxidant)
Anthropometry and mortality • MUST BE AS SIMPLE AS POSSIBLE whilst giving reliable information • Collect essential, but not excess data • Theoretical sound methods - • existing guidelines to be updated • Practical problems - need to systematize how constraints are addressed • Security, arrivals from inaccessible areas • Mobility of population • Topography • Transparency - need standard reporting format. Survey and proposal to be separate
Survey data • Cannot be interpreted in isolation • There has to be contextual data. It is usually such data that prompted the survey in the first place. • Cannot be used to decide how and which programs should be implemented • Must always be accompanied by data on population size and structure
When to do a survey? • Criteria should be clearly defined. • How to do a survey? • Methods should be simple and standard • Design • Training • Sampling • Measurement • Quality assurance • Analysis • Reporting • How to interpret the results? • Needs to be put into context: this varies • What a survey CAN tell us – severity NOW, “calibration” of surveillance data. • What it cannot tell us – reasons, incidence or trends How to tell if the survey is reliable?
Few organisations have all the expertise needed for anthropometric, mortality and other data collection. Field experience, Epidemiological capacity, Demographic expertise, anthropological knowledge, interpretative skills, programatic expertise • Survey Design Training Sampling Measurement and data entry Quality assurance Analysis Reporting Interpretation. Design of intervention Impact assessment • Multi-disiplinary team needed to assist and overview?
When to do a survey? • Baseline data • Problem with: • Food security indicators • Economic, weather, harvest predictions • Political turmoil • Health centre/ hospital data • Seasonality • ??? Donor funding cycle ???
Total admissions with wasting or oedema to 23 TFCs in Burundi
The relation between wasting and CMR is not close.Oedematous malnutrition Micronutrient deficiency Infectious disease Others (e.g. exposure, toxic foods, trauma, smoke pollution)
Other Nutritional causes of a rise in mortality rate • CMR high with relatively low wasting rate. • Type 1 nutrient deficiency is not associated with wasting. • Failure of wasting rate to predict increase in CMR. This was the main sign of mortality associated with a pellagra outbreak.
Diet quality diseases like kwashiorkor, Pellagra and scurvy are not associated with anthropometric change if there is Type 1 nutrient deficiency (data from Kuito, Angola, 2001)
Patients with pellagra in an emergency situation are normal or fat!
Mortality data • Much more difficult than anthropometry and prone to error. Different methods often give different results - e.g. Denan, 20 fold difference • Retrospective survey 8.9/10,000/d • mortality surveillance <0.5/10,000/d • Discrepant data often not reported: • High mortality - is it an error or is it real? • If real do something now • if an error, suppress data as the agency reputation at stake
Mortality data Bias with mortality estimates in development are exaggerated in emergency • More incentive to hide the truth - with hostilities or prospect of relief • Absent/arriving individuals & families/ split families • Hiding, kidnap, migration, death • Migration patterns - with split familiesmigrants often take the healthy • Date and age problems - traumatised population • seasonality exaggerated • Translation problems - mixed ethnic groups
Triangulation of mortality data • Retrospective survey • Surveillance data • Grave counting • Religious authority records • Demographic profile change • Mother: child ratio • Is it important to know who dies? • Is it important to know cause of death?
Demographic profile • Population age-sex pyramid should be constructed and analysed wherever possible • demographic expertise essential • Methods available for “cleaning” digit preference in age etc. • Population size is very important, very difficult to ascertain and prone to both error and to “political adjustment”. • Geographical/demographic information not only of interest for relief, but also for those engaged in hostilities.
Triangulation of data Anthropometry & oedema prevalence Program coverage Mortality data Surveillance Incidence/coverage Population size and structure Other data needed to interpret discrepancies Other data needed to understand causes
What is needed? • Historic Survey Data /rapid assessment, and current data using standard, reliable, repeatable methodology in which we all have confidence. Transparent disclosure of constraints. • Integration with surveillance data reporting system • Repeat Surveys to “recalibrate” surveillance data, look at trends and define “normal status/variation”. • Contextual data to interpret trends or changes • Evaluation of Impact • Capacity Building • Data collection/Analysis • Integration/Coordination • Local Capacity for programs and Ethical Integrated Closing Strategies for programs • Donor Understanding and Support – smile