KWL Charts
60 likes | 204 Vues
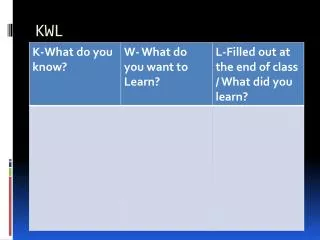
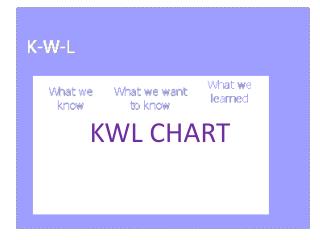
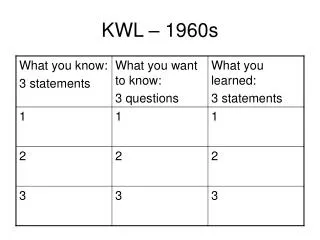
KWL Charts. KWL Chart on Slavery. The K Section of the Chart.

KWL Charts
E N D
Presentation Transcript
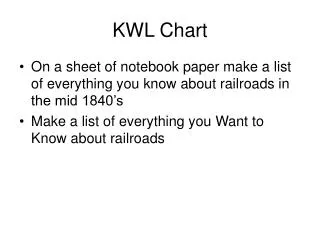
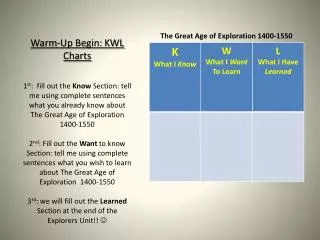
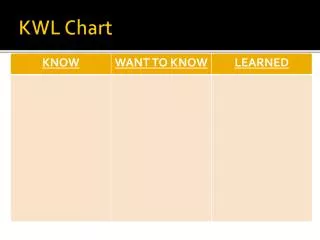
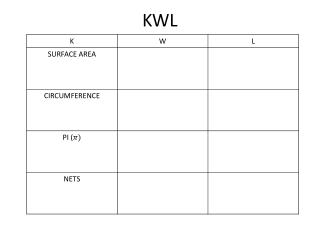
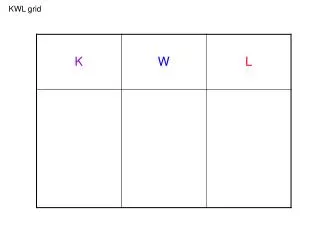
The K Section of the Chart • At the beginning of the lesson, discuss with the students what they think they know about the topic (K). Fill in the first column of the chart with their responses. Do not correct inaccurate responses, as part of their research will be to verify what they think they know. During their research, students can mark the proven statements, and cross out the inaccurate ones. When a statement is proven inaccurate, take time to discuss it with the students and compare the correct information with their initial belief
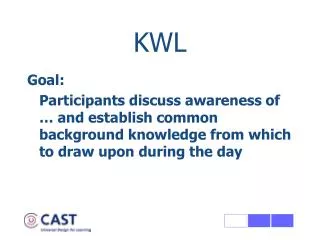
The W Section of the Chart • Give students a few minutes to brainstorm with a partner about what they would like to know about the topic (W). Model questions such as “I would like to know….” Or “A question I have about “??” is…”, and write an example question in the top of the second column. Questions can be discussed and added to the chart as a group.
The L Section of the Chart • When students are conducting their research, and find information that either disproves an initial statement from the “K” column or answers a question from the “W” column, it can be written in the “L” column, for “What we Learned”. Be sure to discuss as a group anything that is added to this column - this can be done after the research is completed. Students may also want to include any other interesting information that they find that is relevant to their individual topics on their printed out charts.
KWL Links • http://www.youtube.com/watch?v=o4Fq_pBT4p8 • http://en.wikipedia.org/wiki/KWL_table • http://www.enchantedlearning.com/graphicorganizers/KWHL/