### Study of Ultra-High Energy Cosmic Radiation: Energy Spectrum and Composition Analysis ###
This study presents an analysis of the energy spectrum and composition of primary cosmic radiation at super-high energies. Utilizing the Yakutsk array, which includes surface scintillation detectors and underground muon detectors, the research employs various methods, including the CIC method, to estimate energy from Extensive Air Showers (EAS). By comparing detector readings with simulated showers, we seek to determine energy estimates, atomic numbers, and interaction parameters relevant to cosmic ray physics. ###

### Study of Ultra-High Energy Cosmic Radiation: Energy Spectrum and Composition Analysis ###
E N D
Presentation Transcript
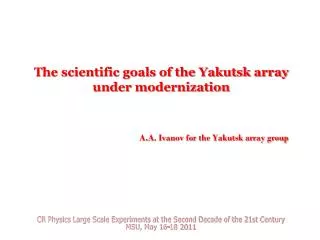
Study of the Energy Spectrum and the Composition of the Primary Cosmic Radiation at Super-high Energies QUARKS-2010, Kolomna
By L.G. Dedenko1, A.V. Glushkov2, G.F. Fedorova1, S.P. Knurenko2, a.A. Makarov2, M.I. Pravdin2, T.M. Roganova1, I.Ye. Sleptzov2 • 1. M.V. Lomonosov Moscow State University, Faculty of Physics and D.V. Skobeltzin Institute of Nuclear Physics, Moscow, 119992, Leninskie Gory, Russian Federation • 2. Insitute of cosmic rays and aeronomy. Yakutsk, Russian Federation QUARKS-2010, Kolomna
Yakutsk array • The Yakutsk array includes • the surface scintillation detectors (SD) and • detectors of theVavilov-Cherenkovradiation • and undergrounddetectors of muons (UD) with the threshold energy ~1 GeV. QUARKS-2010, Kolomna
Detectors readings induced by EAS particles • The various particles • of Extensive Air Showers (EAS) • at the observation level • hit detectors and • induce some signals sampled as • detector readings QUARKS-2010, Kolomna
Standard approach of energy estimation • s(600) – signal at 600 m in the vertical EAS used to estimate energy E of EAS. • DATA: • 1. The CIC method to estimate s(600) from data for the inclined EAS. • 2. The signal s(600) is calibrated with • help of the Vavilov-Cherenkov radiation • E=4.6·1017· s(600), eV QUARKS-2010, Kolomna
Standard AGASA approach • Like AGASA: • 1. The CIC method to estimate s(600) from data for the inclined EAS. • 2. Calculation s(600) for EAS with • energy E: • E=3·1017·s(600), eV QUARKS-2010, Kolomna
Spectrum • Energy spectra are different for these approaches QUARKS-2010, Kolomna
points ─ Yakutsk data circles ─ Yakutsk (calculation like AGASA) stars ─ PAO QUARKS-2010, Kolomna
The CIC method • The constant intensity cut (CIC) method: • systematic error! • For Yakutsk array the absorption length • 458 g/cm2 • (to be compared with 340 g/cm2) QUARKS-2010, Kolomna
Yakutsk array. New approach • All detectors readings • are suggested to be used to study • the energy spectrum and • the chemical composition of • the primary cosmic radiation • at ultra-high energies • in terms of some model of hadron interactions. QUARKS-2010, Kolomna
The new method • For the individual EAS • the energy E and • the type of the primary particle, (atomic number A), which induced EAS, • parameters of model of hadron interactions, • peculiar development of EAS in the atmosphere • are not known QUARKS-2010, Kolomna
The new method • The goal: • to find estimates of • the energy E and atomic number A, • parameters of model of hadron interactions, • peculiar development of EAS in the atmosphere • for each individual shower QUARKS-2010, Kolomna
The new method It has been suggested for the one observed EAS to estimate all detector readings • for manysimulated individual showers, • induced by various primary particles • with different energies • in terms of various models. QUARKS-2010, Kolomna
The new method • All these detector readings • for all simulated individual showers • should be compared with • detector readings of • one observed EAS QUARKS-2010, Kolomna
The new method • The best estimates of • the energy E, • the atomic number A and • parameters of model and • peculiar development of EAS in • the atmosphere are searched by • the χ2 method. QUARKS-2010, Kolomna
The new method • The best estimates • of the arrival direction and • core location • are also searched by the χ2 method. QUARKS-2010, Kolomna
Simulations • Simulations of the individual shower developmentin the atmosphere • have been carried out with the help of • the codeCORSIKA-6.616 [8] • in terms of the models QGSJET2 [9] and Gheisha 2002 [10] • with the weightparameter ε=10-8(thinning). QUARKS-2010, Kolomna
Simulations • The program GEANT4 [11] has been used • to estimate signals in the scintillation detectors • from electrons, positrons, gammas and muons • in each individual shower. QUARKS-2010, Kolomna
Detector model QUARKS-2010, Kolomna
Signals in scintillation detector • Signals ∆E in MeV • as functions of • energy E • and the cos( teta) • (teta – the zenith angle) • of incoming particles QUARKS-2010, Kolomna
Electrons QUARKS-2010, Kolomna
Positrons QUARKS-2010, Kolomna
Gammas QUARKS-2010, Kolomna
Отклики от мюонов Muons QUARKS-2010, Kolomna
Minimum of the function χ2 • Readings of all scintillation detectors have been used to search for the minimum of the function χ2in the square with the width of 400 m and a • center determined by data with a step of 1 m. • These readings have been compared with calculated responses for E0=1020 eV multiplied by the coefficient C. This coefficient changed from 0.1 up to 4.5 with a step of 0.1. QUARKS-2010, Kolomna
Minimum of the function χ2 • Thus, it was assumed, that the energy of a shower and signals in the scintillation detectors are proportional to each other in some small interval. • New estimates of energy • E =C·E0 eV, QUARKS-2010, Kolomna
Results of energy estimations • The 16 various values of energy estimates for 16 individual simulated showers induced by • protons, He, O and Fe nuclei • have been obtained for the same sample of the 31 experimental readings of the observed giant shower with different values of the function χ2. QUARKS-2010, Kolomna
Results for the most energetic shower observed at the Yakutsk array QUARKS-2010, Kolomna
Simulations • New estimates of energy • of the giant air showerobserved at YA • have been calculated in terms of the QGSJET2 and Gheisha 2002 models: • E≈2.·1020eV forthe proton primaries and • E≈1.7·1020eV for the primary iron nuclei. QUARKS-2010, Kolomna
Minimum of the function χ2 • Coordinates of axis and • values of the function χ2 • have been obtained • for each individual shower QUARKS-2010, Kolomna
Results of energy estimations • The energy estimates are minimal for the iron nuclei primaries • and change inside the interval (1.6−1.75)· 1020 eV • with the value of the χ2 ~ 1.1 per one degree of freedom. QUARKS-2010, Kolomna
Results of energy estimations • For the proton and helium nuclei primaries energy estimates are maximal and • change inside the interval (1.8−2.4)·1020 eV • with the value of the χ2 ~ 0.9 per one degree of freedom. QUARKS-2010, Kolomna
Results of energy estimations • For the oxygen nuclei primaries the energy estimates are • in the interval (1.8−2)·1020eV • which isbetween intervals for proton and iron nuclei primaries • with the value of the χ2 ~ 0.95 per one degree of freedom. QUARKS-2010, Kolomna
Results of energy estimations • Dependence of the value χ2 • per one degree of freedom • on the coefficient • C=E/(1020 eV) QUARKS-2010, Kolomna
Reality of the Yakutsk DATA • The sampling time of signal in the scintillation detetor • τ=2000 ns QUARKS-2010, Kolomna
Fraction of signal: 1-100 m, 2- 600 m, 3- 1000 m, 4-1500 m QUARKS-2010, Kolomna
Energy spectrum • The base spectrum • Jb(E)= A·(E)-3.25, • and the reference spectrum • Jr(E) • areintroduced on the base of the HiRes data QUARKS-2010, Kolomna
Energy spectrum • New variable • y=lgE • In four energy intervals yi(i=1, 2, 3 and 4) • 17.<y1<18.65, • 18.65<y2<19.75, • 19.75<y3<20.01 and • y4>20.01 QUARKS-2010, Kolomna
Spectrum Jr(E) has been approximated by the following exponent functions • J1(E)=A·(E)-3.25, • J2(E)=C·(E)-2.81, • J3(E)=D·(E)-5.1, • J4(E)=J1(E)=A·(E)-3.25 • Constants C and D may be expressed through A and equations forJr(E) at the boundary points. QUARKS-2010, Kolomna
Spectrum • we assume the reference spectrum as • lgzi=lg(Ji(E)/J1(E)), • where i=1, 2, 3, 4. QUARKS-2010, Kolomna
Spectrum • This reference spectrum is represented as follows • lgz1=0, • lgz2=0.44·(y -18.65), • lgz3=0.484-1.85·(y -19.75) • lgz4=0 QUARKS-2010, Kolomna
Spectrum • Results of the spectra J(E) • observed at various arrays have been expressed as • lg z=lg (J(E)/Jb(E)) • and are shown in comparison with the reference spectrum. QUARKS-2010, Kolomna
Spectrum • Datalgz=lg(J(E)/Jb(E)) observed at various arrays areshown in Fig. as follows: • (a) − HiRes2(open circles), HiRes1(solid squares), • (b) − PAO (solid circles), • (c) − AGASA (solid triangles), • (d) − Yakutsk (solid pentagons). • The reference spectrum is also shown on all Figures (solid line). QUARKS-2010, Kolomna
HiRes QUARKS-2010, Kolomna
PAO QUARKS-2010, Kolomna