Download
1 / 57
580 likes | 690 Vues
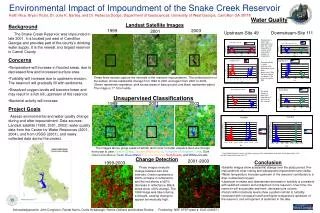
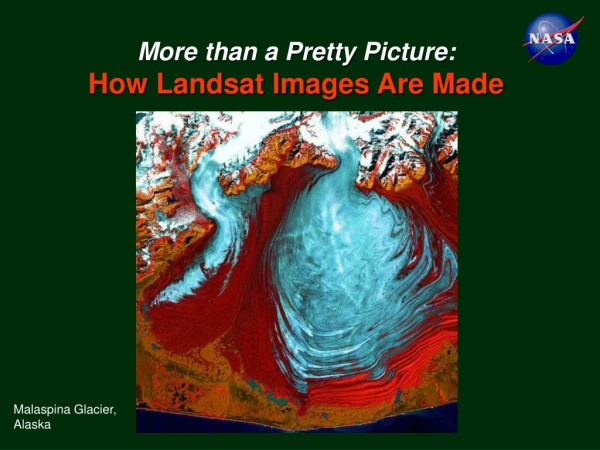
More than a Pretty Picture: How Landsat Images Are Made. Malaspina Glacier, Alaska. Colors in satellite images represent data about the Earth. To understand what the colors mean,. we need to understand light. Landsat image of Betsiboka River, north-central Madagascar.

E N D
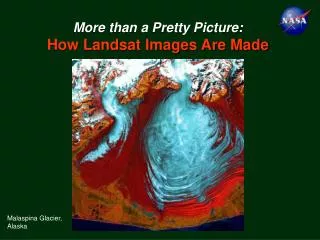
More than a Pretty Picture: How Landsat Images Are Made Malaspina Glacier, Alaska
Colors in satellite images represent data about the Earth. To understand what the colors mean, we need to understand light. Landsat image of Betsiboka River, north-central Madagascar.
Light is energy that radiates from its source. Photo: Jeannette Allen
All objects with a temperature above absolute zero (-273 degrees Celsius) reflect and emit energy that radiates through space. Photo: Jeannette Allen
This radiant energy has electrical and magnetic effects, and so it can be called, “electromagnetic radiation.” Photo: Jeannette Allen
Electromagnetic radiation is the means for many of our interactions with the world. You can see around you because of light energy. When you tune your radio, watch TV, send a text message, or pop popcorn in a microwave oven, you are using electromagnetic energy. Photo: Jeannette Allen
The wholeelectromagnetic (EM) spectrum consists of the longest wavelengths (radio), shortest ones (gamma rays),and everything in between. People have grouped EM waves into these categories in order to talk about them.
Visible light, the light we see with our eyes alone, is a very small partof the whole spectrum of radiant energy in the universe.
We measure radiant energy in wavelengths, from crest to crest. Wavelength (a) is longer than wavelength (b)
Colors have different wavelengths! We see colors as different because they have different wavelengths. Red has the longest wavelengths of visible light, and blue/purple has the shortest wavelengths of visible light.
Our eyes detect the entire visible range of those wavelengths, and our brains process the information into separate colors. Photo: Jeannette Allen
Landsat instruments are designed to detect visible and infrared wavelengths. The Operational Land Imager (OLI) under construction
Landsat instruments measure primarily light that’s reflected from Earth’s surface.
To understand more about how Landsat sensors work, it helps to remember that – As sunlight strikes Earth’s surface, some of it is absorbed, and some of it is reflected back into space. Image Science & Analysis Laboratory, NASA Johnson Space Center - ISS007E10807
About 25 percent of the Sun’s energy is absorbed by the atmosphere; about 50 percent is absorbed by the Earth’s surface; and about 30 percent is reflected back to space. NASA illustration by Robert Simmon. Astronaut photograph ISS013-E-8948
Sunlight has visible light and infrared light, as well light of other wavelengths. Sunlight interacts with the objects it hits. Some of it is absorbed and some of it is reflected by those objects. Photo: Jeannette Allen
We see the light that’s reflected from objects. Photo: Jeannette Allen
Consider a tree and its leaves. Red, green, blue, and infrared light from the sun hit the tree and its leaves. Infrared and green light are reflected from the tree. Red and blue light are absorbed by the tree. In this picture, IR is Infrared light R is red light G is green light B is blue light Image Credit: Canada Centre for Remote Sensing
We see the tree as green, because wavelengths of light we call green are reflected to our eyes by the tree. Image Credit: Canada Centre for Remote Sensing
Wavelengths we see as green are about 525-550 nanometers (nm) in length. Wavelengths we see as red are 630-800 nm in length. The red petals of this poppy flower reflect strongly at wave-lengths of 700 nm. Photo: Jeannette Allen
Every kind of surface reflects light differently, absorbing and reflecting it weakly or strongly in different wavelengths. Photos: Jeannette Allen
Every kind of surface has its own spectral signature, somewhat like a fingerprint. Butter reflects weakly in blue and strongly in yellow to red. Tomato reflects weakly in blue and strongly in red. red blue yellow
This graph shows the spectral signatures of vegetation and water. Notice that water and vegetation reflect somewhat similarly in the visible wavelengths (about 0.4 to 0.7 nm) but are almost always separable in the infrared.
More spectral signatures. Notice how different kinds of surfaces reflect strongly or weakly at different wavelengths. (This graph uses micrometers rather than nanometers.)
A farmer using remote sensing can tell which sugar beet fields are healthy and which are not, if she/he knows their spectral signatures. If s/he were designing a sensor solely to measure the health of his sugar beets, what wavelength range would he want the sensor to detect?
People measure the spectral signatures of different surfaces on the ground. Then when they look at the spectral signature of a surface in a satellite image, they can tell what kind of surface the satellite was looking at. Researcher with hand-held spectrometer
We use our understanding of spectral signatures when we interpret Landsat data. Dragon Lake, Siberia
What’s Special About Landsat • Primary mission: to map Earth’s land surface • Data consistent since 1972 • 16 day repeat • 30-meter resolution • Data publicly available at no cost
Landsat satellites orbit the Earth at 705 km above the surface.
Landsat orbits from north-south, from pole to pole, as Earth turns under it.
The pathway of light used by Landsat: from Sun to ground, then reflected to Landsat, then transmitted to relay stations and sent to computers for analysis. Image Credit: Canada Centre for Remote Sensing
Landsat 5 observes the Earth in 7 ranges (or bands) of the electromagnetic spectrum.
Landsat has a spatial resolution of 30 meters. This means the smallest area on the ground it measures is a 30 m square.
In this illustration of just one band of Landsat data, each square represents a 30m x 30m piece of land surface.
The Landsat instrument records the amount of reflected light in each band for each 30 m pixel, on a scale of 0 to 255. A numerical value of 0 represents no reflected light and a numerical value of 255 represents maximum reflected light. 0: See the corres-ponding black pixel in gray-scale array. 255: See the corresponding white pixel in gray-scale array.
Putting all the layers of data together (all 7 bands plus panchromatic band) amounts to a lot of data! There are 486 Mb of data in one Landsat 7 scene.
Now – how do we make colorimages of all that grayscale data so we can work with it more easily?
We have to assignColorsto represent Landsat bands (using computer software).
Remember, Landsat uses some bands of infrared light.And the human eye is not sensitiveto infrared. So to build an image we can see that includes data about infrared light gathered by Landsat, we must represent that data with colors we can see: red, green, and blue.
Here’s an example. In the images of New Jersey Barrier Islands below, data about reflected near-infrared light (Landsat’s Band 4) has been assigned the color red in the image at lower right. Reflected near-infrared light appears in shades of gray. Reflected near-infrared light appears in shades of red.
People can chose red, green, or blue to represent any of the wavelength ranges they like. One can make lots of color combinations. (This is Beverly, MA.)
1 2 3 4 7 5 6 Visible Infrared 3,2,1 Green Data is shown as Green Blue Data is shown as Blue Red Data is shown as Red
1 2 3 4 7 5 6 Visible Infrared 4,3,2 NIR Data is shown as Red Red Data is shown as Green Green Data is shown as Blue
Visible wavelengths Infrared wavelengths Making images with different band combinations, we see more than we could otherwise. Same scene, different wavelengths
True-Color Composite (3,2,1) True-color composite images approximate the range of vision for the human eye, and hence these images appear to be close to what we would expect to see in a normal photograph. True-color images tend to be low in contrast and somewhat hazy in appearance. This is because blue light is more susceptible than other bandwidths to scattering by the atmosphere. Broad-based analysis of underwater features and landcover are representative applications for true-color composites. Near Infrared Composite (4,3,2) Adding a near infrared (NIR) band and dropping the visible blue band creates a near infrared composite image. Vegetation in the NIR band is highly reflective due to chlorophyll, and an NIR composite vividly shows vegetation in various shades of red. Water appears dark, almost black, due to the absorption of energy in the visible red and NIR bands. Shortwave Infrared Composite (7,4,3 or 7,4,2) A shortwave infrared composite image is one that contains at least one shortwave infrared (SWIR) band. Reflectance in the SWIR region is due primarily to moisture content. SWIR bands are especially suited for camouflage detection, change detection, disturbed soils, soil type, and vegetation stress. Mount Rainier
Landsat 7, Path 35 Row 34, 09.12.00 True color