Download
1 / 14
140 likes | 296 Vues
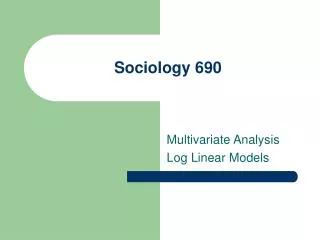
Sociology 690. Multivariate Analysis Log Linear Models. IV DV. Category. Quantity. 1) Analysis of Variance Models (ANOVA). 2) Structural Equation Models (SEM). Quantity. Linear Models. Category. 3) Log Linear Models (LLM). 4) Logistic Regression Models (LRM). Category Models.

E N D
Sociology 690 Multivariate Analysis Log Linear Models
IV DV Category Quantity 1) Analysis of Variance Models (ANOVA) 2) Structural Equation Models (SEM) Quantity Linear Models Category 3) Log Linear Models (LLM) 4) Logistic Regression Models (LRM) Category Models The Analysis of Categories
Cross-classification • Ironically, while categorical data are among the most prevalent form of information collected in sociology, until recently the most dominant types of statistical analysis have been based on continuous data: e.g. t-tests, ANOVA, correlation, regression—in short the general linear model.
Typical Goodness of Fit Model • The analysis of effects among categorical variables has been traditionally accomplished through cross-tabulation tables, utilizing a “goodness of fit” method such as chi square. • To the extent the observed frequencies deviate from expected cell frequencies, we would reject the assumption that the variables are independent and accept the alternative that they are related.
Attend College Sex Yes No Total Female 40 35 75 Male 10 65 75 50 100 150 Total Example of Chi Square Suppose we have the following cross-classification of observed frequencies for two categorical variables: Chi Square would be determined by the following formula: Where the expected frequencies are determined by the formula (fc x fr) / ft
Attend College Sex Yes No Total Female 40 35 75 Male 10 65 75 50 150 100 Total Chi Square Calculation: Here chi square would be calculated as follows: (25-40)2/25 + (50-35)2/50 + (25-10)2/25 + (50-65)2/50 = 9+4.5+9+4.5 = 27. With 1 d.f. (r-1 x c-1) Significance And the measure of association would be derived from chi square (e.g. )
What chi square does not cover • But what if we wanted to examine more than two categorical variables (as in a 2 x 2 x 2 cross-classification table). • This kind of multi-way frequency analysis (sometimes called MFA) could be done by calculating chi-squares on all the possible two-way tables. • However, that would (among other things), prevent us from calculations of any interactions between the variables.
Purpose of Log Linear Analysis • Log-linear models are typically used with multi-way dichotomous or categorical variables. They focus on a procedure for accounting for the distribution of cases in a cross-tabulation of categorical variables. • Based on the association of categorical data (rather than the causal sequencing of independent and dependent variables), LLA looks at all levels of possible interaction effects. In this sense, Log-linear analysis is a type of multi-way frequency analysis (MFA) and sometimes log-linear analysis is labeled MFA.
Definitions in Log linear Analysis • Ln(Fij) = + iA + jB + ijAB, where: • Ln(Fij) = is the log of the expected cell frequency of the cases for cell ij in the contingency table. • = is the overall mean of the natural log of the expected frequencies • = terms each represent “effects” which the variables have on the cell frequencies • A and B = the variables • i and j = refer to the categories within the variables
Procedure for Log Linear Analysis • Choosing the model • Fitting the model • Estimating the Parameters • Testing the Goodness of Fit
Choosing the Model • Saturated vs. Unsaturated If all possible effects are included in the model, is it considered saturated. Unsaturated models are useful when the number of effects equals the number of cell (as would be the case in a 2 x 2 table). • Hierarchical vs. Non-Hierarchical The former implies that if we have a higher interaction effect in our model (e.g. AxBXC), we must include a lower interaction effect (e.g. AxB)
Attend College Sex Yes No Total Female 40 35 75 Male 10 65 75 50 150 100 Total Estimating Parameters Odds and Odds Ratios: In our original cross-tabulation table, the odds of being female is 75/75 or 1.0. The odds of being in college is 40/10 or 4.0 and the odds of no being in college are 35/65 or .54. An odds ratio is the conditional odds of one category divided by the conditional odds of the of the other category. Hence the odds ratio for women being in college is 4.0/.54 or 7.55. Odds ratios greater than one = a relationship.