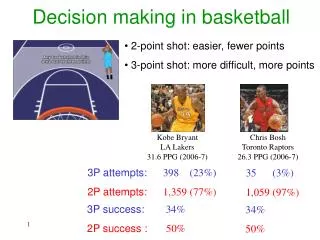
Download
1 / 18
180 likes | 283 Vues
This project aims to enhance decision-making in choosing projections for GIS professionals, providing tools for comparison, distortion display, and adjusting parameters. It addresses common challenges faced in projection selection processes. The timeline includes key milestones such as automating area distortion evaluation and analyzing projection sensitivity. Literature references enrich the project's background and methodologies.

E N D
Improving Decision Making in Choosing a Projection Michael Braymen
Overview • Objective • Background • Problem • Proposed Solution • Process • Obstacles • Timeline • Literature
Objective • To facilitate decision making in choosing projections. • Expand the common decision process for choosing projections • Create a tool that will allow comparison of different projections • Display distortion of various characteristics of projections both graphically and quantifiably. • The audience for the tool would be GIS professionals • Prepare results in form for non-GIS professional.
Background • Early GIS adopters used common choices and local projections like UTM and State plane • Now easier and faster to project • Push to combine data into larger extents
Problem • Organizations using GIS may not have expertise in-house to make good decisions on projection choice • Example: USDA Forest Service
Proposed Solution • Create tools to assist the decision making process • Decision tree for common parameters and characteristics • Graphic tool to display distortion of selected characteristics with quantifiable values
Process • Two methods: • Tissot’s indicatrix • Grid of equal area polygons
Tissot’s indicatrix • The theory that at every point on a map there is a pair of perpendicular lines that are also perpendicular on the earth (Snyder 1987). • Infinitely small circles on the earth always project as perfect ellipses with the ratio of the major and minor axis related to scale and angular deformation. • A statistical assessment of distortion can be done using a series of indicatrices for an area of interest.
Tissot’s indicatrix B. A. C. D.
Grid of equal area polygons • Select equal area projection for area of interest • Generate grid of equal area polygons • Project grid to projection of interest • Calculate difference in area from original, i.e. “true” area • Calculate statistics and display
Generate Grid • <graphic Examples>
Obstacles • Determining how to calculate Tissot’s indicatrix for any area of interest and projection. • Assessing and minimizing additional distortion due to point to point projection, e.g. lengths being shorter than they should be in a projection because a two vertex line should be a curve.
Densify Arcs – Preliminary Results • Original Arc length 10,000 meters • Add vertex every 100 meters • Compare results of projection to Lambert conformal conic for original and densified data • Single example – • 3 mm gap • Difference in perimeter = 0.008 meters • Difference in area = 48 square meters • Difference in computed error = 0.00005 %
Estimated Timeline • JULY - Document process for determining key characteristics and thresholds • AUGUST - Automate evaluation of area distortion using equal area grid technique. • AUGUST - Analyze effect of vertex density on projection distortion • SEPTEMBER - Automate evaluation of shape, scale and area using Tissot’s indicatrix • OCTOBER - Analyze sensitivity of analysis for continental and sub-continental extents • NOVEMBER – Format and automate presentation of results • ???? – Present Results
Literature • Adams, Oscar S. 1919, General Theory of Polyconic Projections: Washington, Government Printing Office. • Deetz, Charles and Adams, Oscar S. 1945, Elements of Map Projection with Applications to Map and Chart Construction: New York, Greenwood Press. • Snyder, John Parr, 1987 Map Projections – A Working Manual, US Geographical Survey Professional Paper 1395: Washington, Government Printing Office, ppg 20-21. • Tissot, Nicolas Auguste, 1881, Mémoire sur la représentation des surfaces et les projections des cartes géographiques: Paris, Gauthier Villars.