Download
1 / 28
280 likes | 297 Vues
Delve into conceptual and policy issues in analyzing rural deprivation in Northern Ireland, focusing on poverty, social disadvantage, and resource allocation models.

E N D
Committee for Agriculture and Rural Development Northern Ireland Assembly 2ndDecember 2014 Accounting for Rural deprivation
Questions To be addressed in this Presentation • Conceptual issues in the construction of Deprivation Indices • Distributions across Urban and Rural Areas in Northern Ireland • The effects of Spatial Aggregation • Designing Resource Allocation Models
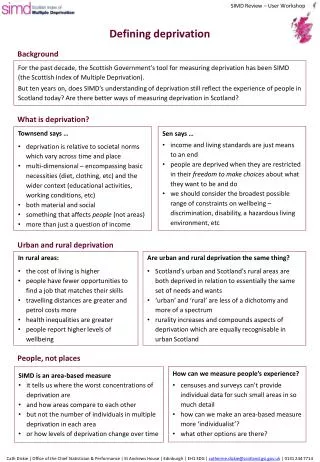
A Comprehensive Definition of Poverty • Relative Poverty “People are living in poverty if their income and resources (material, cultural and social) are so inadequate as to preclude them from having a standard of living which is regarded as acceptable by Irish society generally.” (Government of Ireland, NAPS, 1997) • Relative Deprivation “The fundamental implication of the term deprivation is of an absence – of essential or desirable attributes, possessions and opportunities which are considered no more than the minimum by that society.” (Coombes et al., DoE – UK, 1995)
The Underlying Dimensions of Social Disadvantage • Demographic Decline(predominantly rural) • population loss and the social and demographic effects of emigration (age dependency, low education of adult population) • Social Class Deprivation(applying in rural and urban areas) • social class composition, education, housing quality • Labour Market Deprivation(predominantly urban) • unemployment, lone parents, low skills base
Dimensionality of the 2011 All-Island HP deprivation Index Age Dependency Rate d Demographic Decline d Population Change Low Qualification d d High Qualification Social Class Disadvantage d Persons per Room d High Social Classes d Low Social Classes Labour Market Deprivation d Lone Parents d Male Unemployment d Female Unemployment
Population Change 2006 - 2011 NI: 4.1% RoI: 8.2%
Age Dependency2011 NI: 34.1% RoI: 33.0%
Lone Parents2011 NI: 29.3% RoI: 21.6%
Low Qualifications2011 NI: 40.6% RoI: 36.8%
High Qualifications2011 NI: 23.7% RoI: 23.5%
Low Social Class2011 NI: 34.2% RoI: 27.0%
High social Class2011 NI: 31.1% RoI: 27.9%
Male ILO Unemployment2011 NI: 10.7% RoI: 19.8%
Female ILO Unemployment2011 NI: 5.9% RoI: 12.5%
Persons per Room2011 NI: 0.45 RoI: 0.50
2011 All-IslandHP deprivation Index Score NI: 3.0 RoI: - 0.7
Three Major Observations By 2011 Northern Ireland had become the more affluent of the two jurisdictions. This is of considerable interest, as the relative positions of Northern Ireland and the Republic of Ireland are reversed compared with our previous analysis. The driving factor in this striking development has been the ability of Northern Ireland to maintain a comparatively high level of employment despite the unfavourable economic climate since roughly the mid-point of the inter-census period. The third observation that emerges is that rural areas in the Republic of Ireland appear to be much more negatively affected by opportunity deprivation than equivalent areas in Northern Ireland.
Comparison of the Distribution of the All-Island HP deprivation Scores North and South
Comparing the All-Island HP deprivation Index and NI Multiple Deprivation Measures – NI only N = 4,537 (SA)
Urban Rural contrast – NI onlyHP deprivation Index Most Deprived Decile 6.8% 93.2%
Urban Rural contrast – NI onlyNIMDM 2.6% 97.4% Most deprived Decile
Urban and Rural Shares in Most deprived decile of Areas in Northern Ireland
Ward-level deprivation based on2011 All-Island HP deprivation Index
Ward-level deprivation based on2010 SA-level Multiple Deprivation Measures
Ward-level deprivation based on2010 Ward-level Multiple Deprivation Measures
Building resource Allocation Systems: Modelling Population Shares according to relative DeprivationT – Total PopulationL – low (48.3%)M – Medium (22.4%)H – High ( 7.4%) L: 0 STD 48.3% Population T : >5 STD (Total Population) M: -1 STD 22.4% H: -2 STD 7.4%
2011 All-IslandHP deprivation Index Scores forCounties and Local Government Districts