Download
1 / 30
300 likes | 324 Vues
This study examines the surface chlorophyll concentrations and carbon biomass in the tropical Pacific and Atlantic oceans, utilizing a basin-scale model for comparison. Results show that carbon biomass is lower in the tropical Pacific than the Atlantic. The text outlines the model derivation, calibration, and validation processes in each ocean basin, presenting data on chlorophyll dynamics and growth rates. The study concludes that the Pacific has a higher C:Chl ratio compared to the Atlantic, with implications for understanding primary production and temporal variability in these regions.

E N D
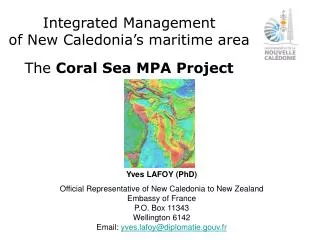
Phytoplankton C:Chl difference between tropical Pacific & Atlantic: Implications for C estimates Wendy WangUniversity of Maryland/ESSIC Collaborators: Ragu Murtugudde: ESSIC/UMDRobert Le Borgne: IRD, New Caledonia Mike Behrenfeld: Oregon State University Emmanuel Boss: University of Maine Susan Brown: SOEST/Hawaii Uni. Emilio Maranon: University of Vigo, Spain
Outline • Motivation/Scientific Question • Modeling Approach • Results & Conclusion • Future Work
Surface chlorophyll from SeaWiFS • Pacific: 0.1-0.3 • Atlantic: 0.1-0.5
A big question: Is carbon biomass lower in tropical Pacific than Atlantic? Basin-scale C:Chl ratio!!
Basin-scale Modeling • Model derivation & cal/val in Pacific • Model application & cal/val in Atlantic • Comparison of C:Chl & carbon biomass between Pacific and Atlantic
A fully coupled basin-scale model OGCM: Gent & Cane (1989) Murtugudde et al.(1996) Ecosystem model: Christian et al.(2001) Wang et al. (2006a) Wang et al. (2008) C chemistry model: Wang et al. (2006b) Phyto. dynamic model: Wang et al.(2009) Atm. Forcing/ SAM (PAR) (AT, WS, SR, P) (WS) PDM (C:Chl) (t) DMEC OGCM (N) (u, v, t, s)
Dynamic Ecosystem-Carbon Model Chlorophyll
C:Chl vs. depth (data from Le Bouteiller et al., 2003) 0° η0 3°S • Linear decrease in EZ • Similar value at ED • C:Chl (<3μm): • 0°: ~140 • 3°S: ~220 , , , ηMIN (<3μm)
Parameterization of vertical C:Chl (η)(Wang et al., 2009) (ZE: euphotic depth) , , ,
Surface C:Chl vs. growth rate (μ0*)(Le Bouteiller et al., 2003) Community • Non-light limitation: • η0 linearly decrease with μ0* • C:Chl ratio: • higher in small cell than large cell , , , Small cells (<3μm)
Parameterization of surface C:Chl (Wang et al., 2009) , , , , ,
Model (Wang et al., 2009) Data (180°, Oct-Nov, 96)(Brown et al. 2003)
Model & data agree: • C: highest at 0° • DCM: depth & Chl conc. • C:Chl: 80-140 (surface) • ~40 at 100 m
Data distribution in eq. Pacific 1996 2005 2006 2007 1994/96
Model Data DCM depth: ~100m in WP ~50m in CEP Chl. in WP ML: <0.1 Chl. at DCM: 0.2-0.3
Model skills , , , • R: 03-0.7 • NSD: 1-1.5 • Z. R > M. R • Spat/Temp: • R>0.7 • NSD=1
Summary (eq. Pacific) • PDM reproduces zonal DCM: ~100 m in WP ~50 m in C/EEP • Spatial & temporal variations: Interannual: model & data agree well HNLC frontal features
AMT 1-12 (1995-2000): • Bio-optical • Phytoplankton • Zooplankton • AMT-3: • (Sep-Oct, 96) • Chlorophyll • Carbon • Nitrate • PP
Model vs. data • Surface chl: • The same (0.1-0.2) • DCM chl: • Model > data • DCM depth: • The same (50-150m)
Model vs. data • Surface C: • Similar (8-16) • DBM C: • ? • DBM depth: • Similar?
Model vs. data (1997-2007) surface Chl in Atlantic Open ocean:similar magnitude & spatial pattern
Summary (eq. Atlantic) • PDM reproduces meridional DCM: South: >120 m North: ~50 m • Surface C & Chl: Model & data agree well
Pacific vs. Atlantic , , ,
Conclusion • Chl: Pacific < Atlantic • C:Chl ratio: Pacific > Atlantic • Carbon: Pacific ≥ Atlantic
Future work • What about primary production? • C:Chl ratio: Pacific > Atlantic • Growth rate: Pacific < Atlantic • PP: ??? • Temporal variability? • Pacific: interannual > seasonal • Atlantic: ???