Digital Audio
Digital Audio. Sound is a continuous wave that travels through the air The wave is made up of pressure differences. Sound is detected by measuring the pressure level at a location Sound waves have normal wave properties (reflection, refraction, diffraction etc.). Sound Facts.

Digital Audio
E N D
Presentation Transcript
Sound is a continuous wave that travels through the air The wave is made up of pressure differences. Sound is detected by measuring the pressure level at a location Sound waves have normal wave properties (reflection, refraction, diffraction etc.) Sound Facts The human Ear detecting Sound
Wave Characteristics Frequency: Represents the number of periods in a second and is measured in hertz (Hz) or cycles per second. Human hearing frequency range: 20Hz to 20kHz (audio) Amplitude: The measure of displacement of the air pressure wave from its mean. Related to but not the same as loudness Sound Facts Amplitude Air Pressure Time One Period One particular frequency component
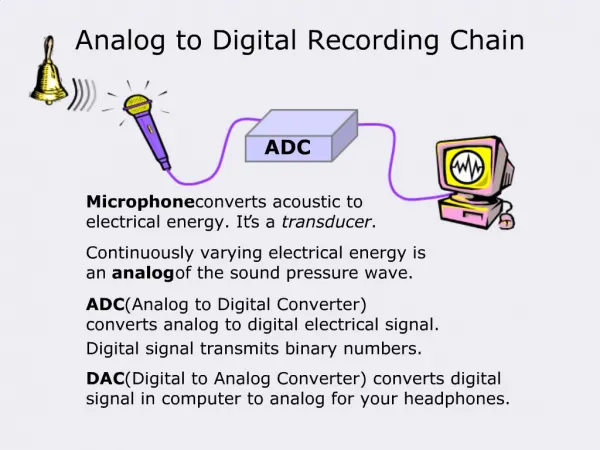
Why Digitize? To store audio or video data into a computer, we must digitize it by converting it into a stream of numbers. Principles of Digitization Sound as analog signal
Sample Rate and Bit Depth Bogus analogy: Imagine you wanted to replicate a sandwich. In order to reproduce the sandwich, we must represent both the length and thickness of the sandwich. If we were to take several close up pictures of this sandwich, we would soon find out that the more pictures we took, the better chance we would have of replicating the sandwich.
If we took only a few pictures close up, we would not have a very good sandwich
The More pictures we take the better chance we have of creating what we want. The is known as the sample rate… the more samples, the better the sandwich!
The deeper the picture, the better chance we haveof getting the whole sandwich! This is known as bit depth! Eat a small bit…only taste the crust….eat a big bite taste it all!
The Sandwich equals one Second of a sound. Sample Rate How many measurement points per second Bit Depth How much information is represented at any given sample point is the bit depth. Also known as quantization.
Sampling: Divide the horizontal axis (time) into discrete pieces Quantization: Divide the vertical axis (signal strength - voltage) into pieces. For example, 8-bit quantization divides the vertical axis into 256 levels. 16 bit gives you 65536 levels. Lower the quantization, lower the quality of the sound Linear vs. Non-Linear quantization: If the scale used for the vertical axis is linear we say its linear quantization; If its logarithmic then we call it non-linear (-law or A-law in Europe). The non-linear scale is used because small amplitude signals are more likely to occur than large amplitude signals, and they are less likely to mask any noise. Principles of Digitization
Sampling and Quantization • Sampling rate: Number of samples per second (measured in Hz) • E.g., CD standard audio uses a sampling rate of 44,100 Hz (44100 samples per second) Sampling 3-bit quantization • 3-bit quantization gives 8 possible sample values • E.g., CD standard audio uses 16-bit quantization giving 65536 values. • Why Quantize? • To Digitize!
Nyquist Theorem • For Lossless digitization, the sampling rate should be at least twice the maximum frequency responses Consider a sine wave Sampling once a cycle Appears as a constant signal Sampling 1.5 times each cycle Appears as a low frequency sine signal
Application of Nyquist Theorem • Nyquist theorem is used to calculate the optimum sampling rate in order to obtain good audio quality. • The CD standard sampling rate of 44100 Hz means that the waveform is sampled 44100 times per sec. • Digitally sampled audio has a bandwidth of (20 Hz - 20 KHz). By sampling at twice the maximum frequency (40 KHz) we could have achieved good audio quality. • CD audio slightly exceeds this, resulting in an ability to represent a bandwidth of around 22050 Hz.
In any analog system, some of the voltage is what you want to measure (signal), and some of it is random fluctuations (noise). SNR: Signal to Noise ratio captures the quality of a signal (dB) Signal to Quantization Noise Ratio (SQNR) The quantization error (or quantization noise) is the difference between the actual value of the analog signal at the sampling time and the nearest quantization interval value. The largest (worst) quantization error is half of the interval? V2signal Vsignal V2noise Vnoise Quantization (Quality ->SNR) SNR = 10 log = 20 log
Vsignal 2N-1 Vquant - noise 1/2 SQNR Calculation (WC) • If we use N bits per sample, the range of the digital signal is: -2N-1 to 2N-1 • The worst-case signal to quantization noise ratio is given by: = 20 log SQNR = 20 log = N x 20 log 2 = 6.02N (dB) • Each bit adds about 6 dB of resolution, so 16 bits enable a maximum SQNR = 96 dB.
Miscellaneous Audio Facts Typical Audio Formats • Popular audio file formats include .au (Unix), .aiff (MAC, SGI), .wav (PC, DEC) • A simple and widely used audio compression method is Adaptive Delta Pulse Code Modulation (ADPCM). Based on past samples, it predicts the next sample and encodes the difference between the actual value and the predicted value.