Download
1 / 17
170 likes | 332 Vues
Data Mining in SQL Server 2000 and Yukon. Richard Lees EasternMining@Hotmail.com RichardLees.com.au. Agenda. What isn’t Data Mining Demo What is Data Mining Demo Create a data mine 4 ways to view data mine What’s Coming in Yukon Demo Questions Throughout.

E N D
Data Miningin SQL Server 2000and Yukon Richard Lees EasternMining@Hotmail.com RichardLees.com.au
Agenda • What isn’t Data Mining • Demo • What is Data Mining • Demo • Create a data mine • 4 ways to view data mine • What’s Coming in Yukon • Demo • Questions • Throughout
Which Questions are Data Mining? • Who are our biggest customers? • What are customers buying with cigars? • What are the customer retention levels of our branches? • Which customers have bought olives, feta cheese but no ciabatta bread? • Which regions have the highest male/female ratio of single 20 somethings? • Which region has lowest customer retention levels and list out lost customers?
Demonstration • Ad hoc query • Drill through to details • Business Intelligence tool
History of OLAP and Data Mining Future 2000 1993 1999 19xx 1998 Custom Data Mining available to Fortune 100 Codd’s Defined 12 rules for OLAP • Microsoft SQL 7 • OLAP v1 • OLAP on the Web • ThinSlicer • Many others • Microsoft • SQL 2000 • OLAP v2 • Data Mining • English Query • Data Mining V2 • SQL 2005 • BI Tools SAS and SPSS offer Data Mining tools To those who can afford
Sample Data I Will be Using • Wellington Libraries Loan DB • We wanted sample data for data mining • They were just writing off a data warehouse project • “The experts have spent 12 months trying to import data!” “How could Microsoft help us? The data are in IBM databases!”
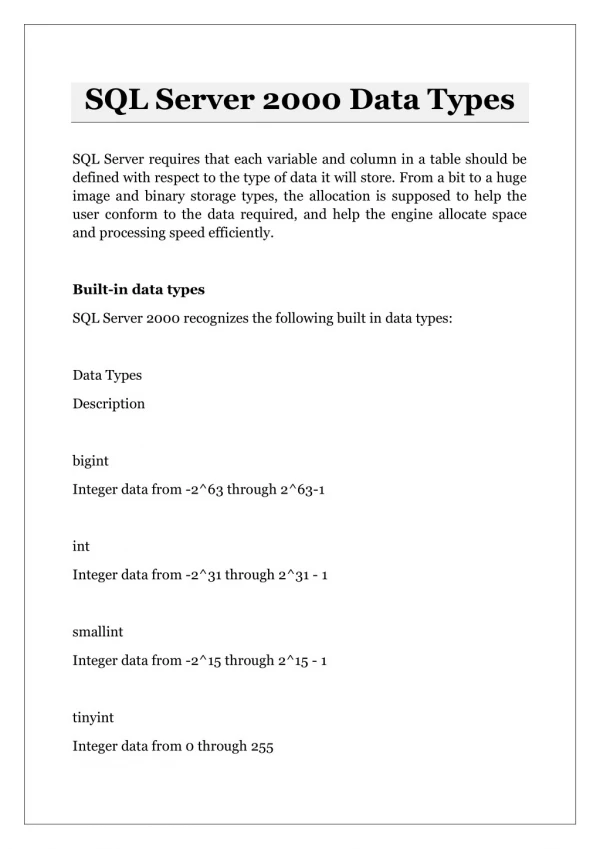
What is Data Mining? “Data mining is the use of powerful software tools to discover significant traits or relationships, from databases or data warehouses and often used to predict future events” • It exploits • statistical algorithms such as decision trees, clustering, sequence clustering, association, naïve bayes, neural network and time series algorithms • Once the “knowledge” is extracted it: • Can be used to discover • Can be used to predict values of other cases
OLAP versus Data Mining • OLAP • Is about fast ad hoc querying • Analysis by dimensions and measures • Gives precise answers • Data Mining • May use rdbms or OLAP source • Is about discovering and predicting • Gives imprecise answers • OLAP is not a prerequisite for data mining, but it almost always comes first (learning to ride a bike before a car)
Clusters Annual Income Age
Decision Trees • Input data • About cases • Discovering relationships • Predicting outcomes
Elite Embedded Data Mining • Demo with real data • Build a data mine • View data mine • Browse dependencies • Browse decision trees • Query using MDX • Query using ThinMiner • Batch update • Uses of Data Mining • Risk assessment • Claim likelihood • Customer profitability predictions • Fraud detection • Treatment efficacy • Product suggestions • Web shopping • Call centre tool
Successful Data Mining Projects Two additional Critical Success Factors • Discover something interesting • Profit from discovery For example ComputerFleet (Localhost)
What’s Coming in Yukon Clustering Time Series Sequence Clustering Naïve Bayes Association Neural Networks Lift Charts Decision Trees Confusion Matrix
.27 /.41 =.67 NOK J NOK (.3x.9)+(.7x.2) =.41 OK .90 (.27) .14 /.41 =.33 .10 (.03) .30 .03 /.59 =.05 .70 .20 (.14) J OK (.3x.1)+(.7x.8) =.59 .56 /.59 =.95 .80 (.56) Judged Actual Actual declared Posterior (actual) Naïve Bayes
Demonstration • Yukon • Development • New algorithms • Lift chart • Profit curve • Query tool
Questions: References Microsoft Research http://Research.Microsoft.com/research/pubs Richard Lees EasternMining@Hotmail.com http://RichardLees.com.au