A ) Prdm16
Additional data file 5 : DNA methylation levels of selected genes in sorted bone marrow cells of PU.1-kd and – wt animals. A ) Prdm16. B ) Robo3. no data. C ) Bcor amplicon 1. D ) Bcor amplicon 2. G ) Itpka amplicon 1. H ) Itpka amplicon 2. E ) Hes6. F ) Tal1.


A ) Prdm16
E N D
Presentation Transcript
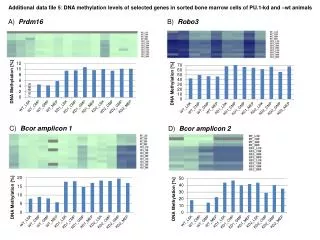
Additional datafile 5: DNA methylationlevelsofselected genes in sortedbonemarrowcellsof PU.1-kd and –wtanimals A) Prdm16 B) Robo3 nodata C) Bcoramplicon 1 D) Bcoramplicon 2
G) Itpkaamplicon 1 H) Itpkaamplicon 2 E) Hes6 F) Tal1 nodata
Methylationlevelsdisplayedasheatmaps (above) and bar graphs (below) ofampliconsfrom genes Prdm16 (A), Robo3 (B), Bcor (C+D), Hes6 (E), Tal1 (F) andItpka (G+H). The sortedcellscomprise LSKs (Lineage negative, Ska1-positive, c-kit negative cells), CMPs (commonmyeloidprogenitorcells), GMPs (granulocyte-macrophageprogenitorcells) and MEPs (megakaryocyte-erythroidprogenitorcells). The PU.1-wt groupcontains a pooloffive PU.1-wt animals, thetwopreleukemic PU.1-kd groups (KD1 and KD2) containpoolsoffourmiceforeachgroup. HeatmapsdisplaysingleCpGunits (columns) of PU.1-kd or PU.1-wt animals (rows). Methylationvaluesrangefrom 0% (light green) to 100% (darkblue). Bar graphsshowaveragemethylation (y-axis) ofthe different amplicons. In A and E, analysisofeach a singlegroupfailed, indicatedbygreyCpGunits in therespectiveheatmapsandmissingvalues in the bar graphs.