Download
1 / 38
380 likes | 390 Vues
Geobiology Week 3 How do microbes garner energy and carbon? Review of redox couples, reaction potential and free energy yields Hydrogen as an energy currency for subsurface microbes. Acknowledgements: Tori Hoehler Redox structure of modern microbial ecosystems

E N D
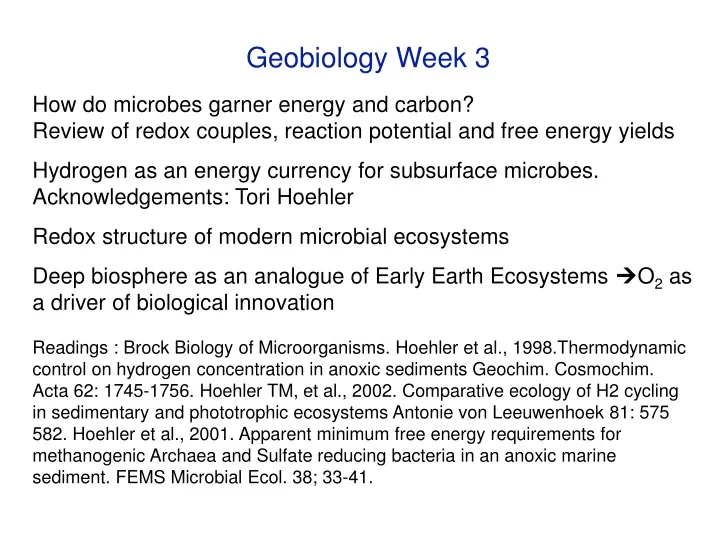
Geobiology Week 3 How do microbes garner energy and carbon? Review of redox couples, reaction potential and free energy yields Hydrogen as an energy currency for subsurface microbes. Acknowledgements: Tori Hoehler Redox structure of modern microbial ecosystems Deep biosphere as an analogue of Early Earth Ecosystems O2 as a driver of biological innovation Readings : Brock Biology of Microorganisms. Hoehler et al., 1998.Thermodynamic control on hydrogen concentration in anoxic sediments Geochim. Cosmochim. Acta 62: 1745-1756. Hoehler TM, et al., 2002. Comparative ecology of H2 cycling in sedimentary and phototrophic ecosystems Antonie von Leeuwenhoek 81: 575 582. Hoehler et al., 2001. Apparent minimum free energy requirements for methanogenic Archaea and Sulfate reducing bacteria in an anoxic marine sediment. FEMS Microbial Ecol. 38; 33-41.
Ecology Microbiology Biogeochemistry A staggering number of organism-organism and organism- environment interactions underlie global biogeochemistry These can be studied at vastly different spatial and time scales
PRESS RELEASE Date Released: Thursday, February 21, 2002 Texas A&M University Rock-eating microbes survive in deep ocean off Peru Rock-eating microbes survive in deep ocean off Peru Way down deep in the ocean off the coast of Peru, in the rocks that form the sea floor, live bacteria that don't need sunlight, don't need carbon dioxide, don't need oxygen. These microbes subsist by eating the very rocks they call home. Researchers from the Ocean Drilling Program (ODP) have embarked aboard the world's largest scientific drillship on a voyage to understand the abundance and diversity of these microbes and the environments in which they live.
Biogeochemical Redox Couples What is the energy currency of metabolic reactions in cells ?? How do cells make it ? What powers those reactions? How do we measure the energy outputs or requirements of metabolism? How can we use this kind of information in an ecological and biogeochemical sense?
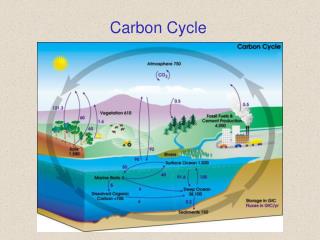
Biogeochemical Redox Couples CO2 + H2O CH2 O + O2oxygenic photosynthesis CH2 O + O2 CO2 + H2O (+) CH4 + 2O2 CO2 + 2H2O(+) oxidative methanotrophy CO2 + HS-+ H2O biomass + SO42- C6H12 O6 2CO2 + 2C2H6O (+ ) fermentation 4H2+SO42- S2-+ 4H2O (+) sulfate reduction CO2 +2H2 CH4 + 2H2O (+) methanogenesis Interdependency? aerobic respiration anoxygenic photosynthesis
Redox Potentials & Energy Yields The electron tower…….. Strongest reductants, or e donors, on top LHS Electrons ‘fall’ until they are ‘caught’ by available acceptors The further they fall before being caught, the greater the difference in reduction potential and energy released by the coupled reactions (Last Common Ances
Redox Potentials & Energy Yields The energetically most favored The energetically most favored reaction proceeds first ie CH2O first degraded with O2 CH2O degraded with NO3 nex CH2O degraded with Mn4+ next followed by SO42-, and CO2 last (methanogenesis)
Energy Calculations • aA +bB ‡ cC + cD • G = Gf°’ (aA + bB) – Gf°’ (cC + dD) • Where Gfo’ is the free energy of formation of 1 mole • under ‘standard’ conditions (pH 7, 25C) • G = G° (T) + RT·ln K • . • K=CcDd/AaBb R= 1.98cal.mol-1.°K-1 • G = G° (T) +RT·ln [C]c[D]d [A]a[B]b
How do microbes garner energy and carbon? Carbon flow Organic compound Electron flow respiration Carbon flow Organic compound Electron flow anaerobic respiration Other organic compound Inorganic compound H2 H2S NH2 Fe2+ Carbon flow Electron flow lithotrophy Biosynthesis
Mechanisms and Balance Sheets Electron Donor Electron “Carrier” NAD + H2 ‡ NADH (catab) or NADP + H2 NADPH (anab) Terminal Electron Acceptor • Balance Sheet: pyruvic acid 3CO2 = 4 NADH + 1 FADH (Flavoproetein e carrier) • 1NADH 3 ATP; 1FADH 2ATP therefore 1 TCA cycle 15ATP; 1 glucose 30ATP • 1ATP 7kcal/mole so 1 molecule glucose 266 kcal • Glucose oxidation with O2G = 688kcal Therefore aerobic respiration ca. 39% efficient • In contrast, glucose fermentation lactate = 29 kcal/mol ca. 50% efficient
Reactions of the TCA Cycle Pyruvate The TCA cycle showing enzymes, substrates and products. The abbreviated enzymes are: IDH = isocitrate dehydrogenase and a-KGDH = a-ketoglutarate dehydrogenase. The GTP generated during the succinate thiokinase (succinyl-CoA synthetase) reaction is equivalent to a mole of ATP by virtue of the presence of nucleoside diphosphokinase. The 3 moles of NADH and 1 mole of FADH2 generated during each round of the cycle feed into the oxidative phosphorylationpathway. Each mole of NADH leads to 3 moles of ATP and each mole of FADH2 leads to 2 moles of ATP. Therefore, for each mole of pyruvate which enters the TCA cycle, 12 moles of ATP can be generated
Balance Sheet: pyruvic acid 3CO2 = 4 NADH + 1 FADH (Flavoproetein e carrier) 1NADH 3 ATP; 1FADH 2ATP therefore 1 TCA cycle 15ATP; 1glucose 30ATP 1ATP 7kcal/mole so 1 molecule glucose 266 kcal Glucose oxidation with O2 G = 688kcal Therefore, in this case, aerobicrespiration ca. 39% efficient In contrast, glucose fermentation lactate = 29 kcal/mol ca. 50%efficient
Multi-Step Organic Matter Remineralization in Anoxic Systems NO3- NH4+ Biopolymers (CH2O)n Mn4+ Mn2+ Monomers Fe3+ Fe2+ Small Organics So42- H2S CO2 CO2 CH4 oxidation reduction Requires numerous extracellular electron transfers
H2 2H+ + 2e- A nearly ubiquitous means ofextracellular electron transport inmicrobial redox chemistry
Hydrogen • Anaerobic metabolism strongly sensitive to pH2 • Fermentation frequently characterized by obligate (1-2 C’s) or facultative (>3 C’s) H2 production • •Reaction only energetically feasibly with H2 sink •Obligate H2 producers don’t grow in ‘pure’ culture •Readily grown in co-culture •H2 consuming reactions affected oppositely
Hydrogen • H2 consuming reactions affected oppositely e.g. with mM SO42-SRB can maintain very low pH2. • In presence of active SRB, H2 too low for methane production to be energetically feasible • Often see zonation between SR and MP under thermodynamic control
Hydrogen • • 2H2+ 2CO2 CH3COOH + O2+ G • • CH3COOH + O2 2H2+ 2CO2+ G • Opposite biochemistry when methanogen present • Anaerobic oxidation of methane is energetically marginal • unless???? • • 2CH4+SO42- S2-+ 2CO2+4H2
H2has a High Relative Stoichiometry in Many Anaerobic Remineralization Processes Production CH3CH2COOH + 2H2O CH3COOH + CO2 + 3H2 Consumption CO2 +4H2 CH4 +2H2O
Free Energy Yield Depends Exponentially onStoichiometry in Reaction CO2 +4H2 CH4 +2H2O PCH4 G= G°(T)+RT‧In PCO2(PH2)4 Gmp is much more sensitive to PH2 than to PCH4 or PCO2
Thermodynamics of Inter-Species H2 Transfer producer Both Organisms Depend Highly on H2 Partial Pressure: Too High Alters Production Pathway Shifts, Inhibition, Reversa Too Low Inhibits Consumption consumer
H2 in the Environment producer PH2 controlled by the balance between production and consumption For constant or decreasing H2 production rate (e.g. sediments), PH2 in practice reflects control by H2 consumption Consumption very efficiently coupled to production; PH2 held at very low steady-state levels; residence times short (seconds or less) consumer
Free Energy Regulation in Methanogenesis 4H2 + CO2 CH4 + 2H2O CH3COOH CH4 + CO2 Data for methanogenic sediments from Cape Lookout Bight at 22°C; Responsiveness [X] and Dt required to change free energy yield by 10kJ/mole
Inter-Species H2 Transfer in a Complex Microbial Ecosystem producer2 producer1 H2 comsumer 1 comsumer 3 producer3 comsumer 2
Controls on Hin Anoxic Sediments producer PH2 in sediments is controlled by H2 consumers Steady-state PH2 reflects efficiency of consumption; constrained by physiologic limitations of H2 consumers Ultimate physiologic limitation: requirement to extract sufficient free energy from H2 consumption to permit continued metabolism consumer
Steady State H2 Concentrations Sensitive To: Concentrations of Products and Reactants (Xox and Xred) Specific Redox Couple (e.g. CO2/CH4 -vs- SO42-/S2-) Temperature Energy Yield of Reaction (Grxn)
Effect of Sulfate Concentration on H2 SO42- + 4H2 S2- + 4H2O Increasing Sulfate = Decreasing H2
Impact of Sulfate Concentration Change on DG and H2 in Sulfate-Reducing CLB Sediments G H2 Expected GSR-vs-SO42- Sulfate (mM) Sulfate (mM) Deduction: H2 is drawn down to compensate for increasing sulfate; SRB community Maintainconst G near limit for ‘maintenance’ but max efficiency. An adaptation to substrate limitation?
Depth Profiles of H2 in CLB Sediments Sulfate (mM) Sulfate (mM) Sulfate Sulfate Depth (cm) August 27oC November 14.5oC H2 (Pa) H2 (Pa)
Inter-Species H2 Transfer in a Complex Microbial comsumer 1 affecting G etc.) Both can be Address Quantitatively comsumer 2
Bulk phase (extracellular) H2 partial pressures are described quantitatively by intracellular thermodynamics PH 2 Extracellular Measurement Intracellular Bioenergetics
Spatial Constraints H2 H2 consumer consumer (HC) (HC) Organic matter H2 producer producer (HP) (HP) H2 measurement H2 measurement HP HP bulk fluid HC HC bulk fluid PH2 measured in bulk fluid = PH2 in HC cell PH2 measured in bulk fluid > PH2 in HC cell Efficient utilization of H2 requires mass transport and high concentration gradient unless mitigated by spatial arrangements. The fact that quantitative H2 etc measurements reflect bioenergetic control argues for non-random arrangement of consumers and producers as illustrated above (see later re AOM)
In Situ Free Energy Yields in CLB Sediments G(KJ·mol-1) G(KJ·mol-1) MP MP Depth (cm) November T=14.5oC August T=27oC
Biogeochemical Redox Couples aerobic respiration CH2 O + O2 CO2 + H2O 1 mole glucose 30-32 mole ATP 1 mole glucose 2-4 mole ATP Biosynthesis requires approx. 1mole ATP per 4g of cell carbon
Biogeochemical Redox Couples oxygenic photosynthesis CO2 + H2O CH2 O + O2
http://www.bris.ac.uk/Depts/Chemistry/MOTM/atp/atp1.htm Molecule of the Month Adenosine Triphosphate - ATP Paul May–Bristol University The 1997 Nobel prize for Chemistry has been awarded to 3 biochemists for the study of the important biological molecule, adenosine triphosphate . This makes it a fitting molecule with which to begin the 1998 collection of Molecule's of the Month. Other versions of this page are: a Chime version and a Chemsymphony version. ATP - Nature's Energy Store All living things, plants and animals, require a continual supply of energy in order to function. The energy is used for all the processes which keep the organism alive. Some of these processes occur continually, such as the metabolism of foods, the synthesis of large, biologically important molecules, e.g. proteins and DNA, and the transport of molecules and ions throughout the organism. Other processes occur only at certain times, such as muscle contraction and other cellular movements. Animals obtain their energy by oxidation of foods, plants do so by trapping the sunlight using chlorophyll. However, before the energy can be used, it is first transformed into a form which the organism can handle easily. This special carrier of energy is the molecule adenosine triphosphate, or ATP
Its Structure The ATP molecule is composed of three components. At the centre is a sugar molecule,ribose (the same sugar that forms the basis of DNA). Attached to one side of this is a base (a group consisting of linked rings of carbon and nitrogen atoms); in this case the base is adenine. The other side of the sugar is attached to a string of phosphate groups. These phosphates are the key to the activity of ATP. ATP consists of a base, in this case adenine (red), a ribose (magenta) and a phosphate chain (blue).
AMP ADP ATP How it works ATP works by losing the endmost phosphate group when instructed to do so by an enzyme. This reaction releases a lot of energy, which the organism can then use to build proteins, contact muscles, etc. The reaction product is adenosine diphosphate (ADP), and the phosphate group either ends up as orthophosphate (HPO4) or attached to another molecule (e.g. an alcohol). Even more energy can be extracted by removing a second phosphate group to produce adenosine monophosphate (AMP) ATP + H2O ADP + HPO4 When the organism is resting and energy is not immediately needed, the reverse reaction takes place and the phosphate group is reattached to the molecule using energy obtained from food or sunlight. Thus the ATP molecule acts as a chemical 'battery', storing energy when it is not needed, but able to release it instantly when the organism requires i
The 1997 Nobel Prize for Chemistry The Nobel prize for Chemistry in 1997 has been shared by: Dr John Walker of the Medical Research Council's Laboratory of Molecular Biology (LMB) at Cambridge (an institution which has been responsible for 10 Nobel prizes since 1958!) Dr Paul Boyer of the University of California at Los Angeles and Dr Jens Skou of Aarhus University in Denmark. The prize was for the determination of the detailed mechanism by which ATP shuttles energy. The enzyme which makes ATP is called ATP synthase, or ATPase, and sits on the mitochondria in animal cells or chloroplasts in plant cells. Walker first determined the amino acid sequence of this enzyme, and then elaborated its 3 dimensional structure. Boyer showed that contrary to the previously accepted belief, the energy requiring step in making ATP is not the synthesis from ADP and phosphate, but the initial binding of the ADP and the phosphate to the enzyme. Skou was the first to show that this enzyme promoted ion transport through membranes, giving an explanation for nerve cell ion transport as well as fundamental properties of all living cells. He later showed that the phosphate group that is ripped from ATP binds to the enzyme directly. This enzyme is capable of transporting sodium ions when phosphorylated like this, but potassium ions when it is not. More details on the chemistry of ATPase can be found here, and you can download the 2 Mbyte pdb file for Bovine ATPase from here. References: Chemistry in Britain, November 1997, and much more information on the history of ATP and ATPase can be found at the Swedish Academy of Sciences and at Oxford University.