Download
1 / 36
370 likes | 632 Vues
Meeting The Joint Commission Ongoing Physician Practice Evaluation Standards January 2009. Kenneth J. Abrams, MD, MBA Senior Vice President, Clinical Operations, Associate Chief Medical Officer, North Shore-Long Island Jewish Health System. Ongoing Professional Practice Evaluation (OPPE).

E N D
Meeting The Joint Commission Ongoing Physician Practice Evaluation StandardsJanuary 2009 Kenneth J. Abrams, MD, MBA Senior Vice President, Clinical Operations, Associate Chief Medical Officer, North Shore-Long Island Jewish Health System
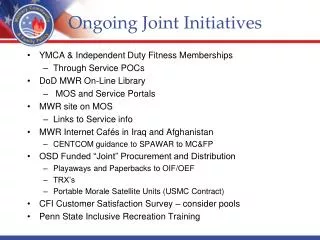
Ongoing Professional Practice Evaluation (OPPE) The intent of the standard is that organizations are looking at data on performance for all practitioners with privileges on an ongoing basis rather than at the two year reappointment process, to allow them to take steps to improve performance on a more timely basis. A clearly defined process would include but not be limited to: • who will be responsible for reviewing performance data • MEC, Credentialing Committee, Department Chair, Department, etc. • how often the data will be reviewed • 3, 6, 9 Month intervals. 12 Month intervals considered “periodic” not ongoing • the process to be implemented to use the data to make decision as to whether to continue, limit or revoke privileges. • Who can make and approve an action • how data will be incorporated into the credentials files. • The decision resulting from the review, whether it be to take an action or to continue the privilege would need to be documented along with the supporting data. - Adopted from The Joint Commission
Joint Commission Physician Credentialing Requirements The following information is suggested to be reviewed on a regular basis as part of “ongoing practice evaluations” of physician performance, in addition to the every 2 year credentialing cycle: • Review of operative & other clinical procedures performed and their outcomes • Adverse events / sentinel events • Pattern of blood and pharmaceutical usage • Requests for tests & procedures • Length of stay patterns • Morbidity and mortality data • Practitioner’s use of consultants • “Other relevant criteria as determined by the medical staff” • Departments need to define the type of data to be monitored. Departments would know best which data would best reflect good and problem performance • Suggestions for collection of data: • periodic chart review • direct observation • monitoring of diagnostic and treatment techniques • discussion with other individuals involved in the care of each patient including consulting physicians, assistants at surgery, nursing, and administrative personnel. - Adopted from The Joint Commission
DataCollection DataReporting DataAnalysis StrategyDevelopment & Deployment Premier Tools Are Designed to Shift the Data Collection Effort Curve Typical Effort Ideal Effort Improving Clinical Practice Patterns Leveraging automated data reduces manual chart review and allows increased time for analysis and problem solving – the key to improving care!
Results of the Evaluation • The information resulting from the evaluation needs to be used to determine whether to continue, limit, or revoke any existing privilege(s) at the time the information is analyzed. Examples: • determining that the practitioner is performing well or within desired expectations and that no further action is warranted • determining that issues exist that require a focused evaluation • revoking the privilege because it is no longer required • suspending the privilege, which suspends the data collection, and notifying the practitioner that if they wish to reactivate it they must request a reactivation • determining that the zero performance should trigger a focused review (MS.4.30 EP 5) whenever the practitioner actually performs the privilege. • determining that the privilege should be continued because the organization's mission is to be able to provide the privilege to its patients - Adopted from The Joint Commission
Focused Professional Practice Evaluation • An intense assessment of a practitioner’s credentials and current performance • New doctors applying for staff privileges • Practitioners requesting new or expanded privileges • Lack of documentation of competency • Triggered by a negative evaluation (criteria should be specified) • Practitioner lacks required case volume • Proctoring – a form of Focused Professional Practice Evaluation • Evaluation of a practitioner’s performance by another peer • Real time – direct observation • Retrospective evaluation by “same specialty” internal or external review.
Engage Medical Staff with Severity-Adjusted Data Premier Clinical Advisor™ Patient Safety Strategic Planning Clinical Performance Physician Performance Regulatory Compliance Financial Performance
Physician Performance Physician Profiles Engage Your Medical Staff Key Applications: • Support physician re-credentialing process • Identify physician practice pattern variances • Identify cost reduction opportunities Value: • Improve compliance with JCAHO PI standards • Reduce staff time generating reports Physician Profile Report
Physician Profiles Engage Your Medical Staff Physician Performance 8/01/2006 through 10/30/2006 Compare performance for: • Individual physicians • Physician groups Understand physician performance for: • Outcomes • Costs & ALOS • Resource Utilization 9/01/2005 through 10/30/2006 Physician Profile Report
Physician Performance Drill to Physician Performance from any Report Analyze Physician Performance on Clinical Outcomes & Efficiency ALOS / Cost Analysis Report Physician Performance on outcome metrics using Report Builder
Physician Activity & Outcome Report State of the Art Performance Based Measurement
Pre 2008 - Practitioner Measurement • Process measures dominated • Raw numbers were substitutes for performance • Data was not risk adjusted • Benchmarks were not utilized • Peer performance was not a standard • Limited focus on resource consumption • No patient satisfaction data
Evolution in Measurement • Multiple domains are necessary to evaluate complex performance • Outcome trumps process • Risk adjustment levels the playing field • Excess resource consumption consistently associated with poor outcomes (Dartmouth) • Patient comments on perception care offer valuable insight beyond statistical rankings • Safety indicators offer insight into benchmarked rates of complications of care
Physician • Specialty • Attending • Consulting • Surgeon ADT • Patient ID • Medical Record • Admit Source • Admit Type • Admit Date • Patient Type • Patient Classification • Discharge Status • Patient Origin Medical Record Content And Data Sources Outcomes • ALOS • Readmits • Complications • Mortality • Outliers • ORYX Indicators Patient Demographics • Birth Date • Age • Race • Gender Clinical Financial • Birth Weight • DRG • 3M APR-DRG™ • PX (Primary & Secondary • DX (Primary & Secondary) • Days on MV • Qty Ordered • Service Date • CPT4/HCPCS • Payor • Secondary Payor • Charges (Dept & Procedure) • Costs ( Dept & Procedure) • Fixed Cost/Px • Variable Cost/Px Medical Record Data Source - Input 13
Report Includes: • Activity of discharges and procedures (data risk adjusted/benchmarked) • Length-of-Stay • Readmission • Mortality • Complications • Patient Safety Indicators • Core Measures • Denials • Liability Claims • Press Ganey
Limitations • Administrative data • Does not capture activities for: • ED • Radiology • Anesthesiologist (except interventional) • Currently, most non-procedural consultants are not mapped for activity • Attribution in group practices not developed • Low volume reports have limited value • Cost data is based charges
Improvement Timetable • October 2008 Begin data capture for Ambulatory Procedures • January 2009 Start data capture for Consulting Activities • September 2008 Begin mapping groups (Hospitalist, OB/Gyn, etc.) • Winter 2009 Web access for individual MD reports
QualityAdvisor Practitioner Profiles Conceptual Design and Prototypes Richard Bankowitz, MD, MBA. Vice President, Medical Director, Premier Healthcare Informatics
QualityAdvisor Practitioner Profile • Interactive online reporting • Custom Comparison Groups • “All Provider” type option to capture all patients, regardless of role • Report Sections • Demographics • Outcomes (in aggregate and trended) • Customize inclusions • Mortality, Morbidity, Complications, LOS, Cost, Charges, Readmissions • Complications • CareScience, AHRQ PSI, CMS HACs, Premier HACs • Customized Resource Use • Top Opportunities • Mortality, LOS, HACs • Core Measure Compliance • Patient Flow • Drilldown to Patient Level Data • Mortality, Complications, and Readmissions
Design Principles for Physician Reports • It should be easy to see where there are problems (opportunities) – There should be a “summary” view and an “opportunity” view • Put all high level information in one place • Use green, yellow, red or other easy to interpret icons (consider printing) • Every metric needs some sort of target (expected value or other target) • The report must display variance from target and flag opportunities (red) • Make the summary level clear and concise and put supporting information in “drill down” detail section – graphs etc. can go in detail • Users should be able to select which metrics they will see in the “top level” summary display, and alter this by physician group (med vs surg) • Users should have the ability to customize the peer comparison group • Users should be able to see best practice performance • Users should be able to choose which “drill downs” will display / print • Users should see trended data over time • Users should be able to drill to find “special cause” variation • Data must be aggregated in meaningful, actionable clusters
Mock-up Define the patient population and peer group. Highlight priorities for action. Describe population characteristics. Graphically display key metrics and comparisons.
QualityAdvisorPremier Hospital Acquired Conditions • There are a number of secondary diagnoses that, when they occur after admission, Premier considers morbid, and should both be tracked for incidence and for patient identification • Examples include • Anaphylactic Shock • Fat Embolism • Adverse Drug Event • Other ’99’ codes • Surgical Comps • Urinary Comps • Neurologic Comps • C. Diff Enteritis • Sepsis/Bacteremia • 2ndary Thrombocytopenia • Phlebitis/Thrombophlebitis • Hemorrhage • Cardiac Arrest • Etc.
System Level Reporting Capability Corporate Region A Region B Region C Region D … System 1 System 2 System 3 • Outcomes and resource utilization tied from patient level all the way to corporate • Security access defined for each level • Start at any level in the roll up … Hospital A Hospital B Hospital C MD I MD II MD III Patient
Targeted Population Analysis • Specific populations targeted for detailed analysis • Heart Failure • Acute Myocardial Infarction • Pneumonia • Stroke • Layered “Dashboard” reporting for online interaction • Control Charts • Drilldown to physician & patient level data • Integrated Evidenced-based data • Core Measures • Resource Utilization • Hip & Knee Surgery • Pregnancy • Cardiac Bypass Surgery • Spine Surgery
Mock-up Top Performer Expected
Readmission Reporting • Risk-adjusted 30-day Readmission Report • Risk of being readmitted based off of initial diagnoses • Readmission Diagnosis Summary Report • Actual readmission rates for specific diagnoses • Flexible readmission timeframes (eg, 7, 14, 30 days, or user defined) • Drilldowns • Readmission Detail (all patients) • Readmission Individual Patient Detail (one patient, multiple admissions)