Download
1 / 1
20 likes | 213 Vues
Natural Resources Conservation Service. Deriving Satellite Crop Rotation Maps for Distributed Modeling of Water Quality in the Choptank River watershed. W. Dean Hively 1 , Ali Sadeghi* 1 , Megan Lang 1 , Varaprasad Bandaru 2 , and Greg McCarty 1 * (301) 504-6693; Ali.Sadeghi@ars.usda.gov

E N D
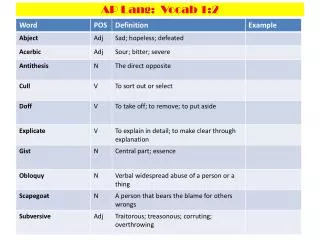
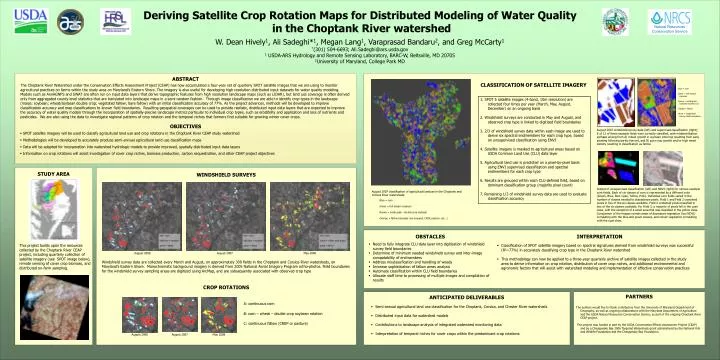
Natural Resources Conservation Service Deriving Satellite Crop Rotation Maps for Distributed Modeling of Water Quality in the Choptank River watershed W. Dean Hively1, Ali Sadeghi*1, Megan Lang1, Varaprasad Bandaru2, and Greg McCarty1 *(301) 504-6693; Ali.Sadeghi@ars.usda.gov 1 USDA-ARS Hydrology and Remote Sensing Laboratory, BARC-W, Beltsville, MD 20705 2University of Maryland, College Park MD ABSTRACT CLASSIFICATION OF SATELLITE IMAGERY The Choptank River Watershed under the Conservation Effects Assessment Project (CEAP) has now accumulated a four-year set of quarterly SPOT satellite images that we are using to monitor agricultural practices on farms within the study area on Maryland’s Eastern Shore. The imagery is also useful for developing high resolution distributed input datasets for water quality modeling. Models such as AnnAGNPS and SWAT are often run on input data layers that derive topographic features from high resolution landscape maps (such as LIDAR), but land use coverage is often derived only from aggregated county-level statistics that are translated into landscape maps in a semi-random fashion. Through image classification we are able to identify crop types in the landscape (maize; soybean; wheat/soybean double crop; vegetated fallow; bare fallow) with an initial classification accuracy of 77%. As the project advances, methods will be developed to improve classification accuracy and map classifications to known field boundaries. Resulting geospatial coverages can be used to provide realistic, distributed input data layers that are expected to improve the accuracy of water quality models through the incorporation of spatially-precise landscape metrics particular to individual crop types, such as erodibility and application and loss of nutrients and pesticides. We are also using the data to investigate regional patterns of crop rotation and the temporal niches that farmers find suitable for growing winter cover crops. blue = corn green = full season soybean brown = small grain – soybean double crop orange = fallow white = windshield survey field boundaries • 1. SPOT 5 satellite images (4-band, 10m resolution) are collected four times per year (March, May, August, December) on an ongoing basis • 2. Windshield surveys are conducted in May and August, and observed crop type is linked to digitized field boundaries • 3. 2/3 of windshield survey data within each image are used to derive six spectral endmembers for each crop type, based on unsupervised classification using ENVI • 4. Satellite imagery is masked to agricultural areas based on USDA Common Land Use (CLU) data layer • 5. Agricultural land use is predicted on a pixel-by-pixel basis using ENVI supervised classification and spectral endmembers for each crop type • 6. Results are grouped within each CLU-defined field, based on dominant classification group (majority pixel count) • 7. Remaining 1/3 of windshield survey data are used to evaluate classification accuracy OBJECTIVES August 2007 windshield survey data (left) and supervised classification (right); 8 of 12 of these example fields were correctly classified, with misidentification perhaps arising from A) robust growth in soybean intercrop resulting from early planting following barley harvest, and B) poor crop growth and/or high weed density resulting in classification as fallow. • SPOT satellite imagery will be used to classify agricultural land use and crop rotations in the Choptank River CEAP study watershed • Methodologies will be developed to accurately produce semi-annual agricultural land use classification maps • Data will be adapted for incorporation into watershed hydrologic models to provide improved, spatially distributed input data layers • Information on crop rotations will assist investigation of cover crop niches, biomass production, carbon sequestration, and other CEAP project objectives STUDY AREA WINDSHIELD SURVEYS Output of unsupervised classification (left) and NDVI (right) for various example corn fields. Each of six classes of corn is represented by a different color (Green, Blue, Red, Cyan, Yellow, Pink). Individual corn fields varied in the number of classes needed to characterize pixels. Field 1 and Field 2 contained pixels in five of the six classes available. Field 4 contained pixels classified in two of the six classes available. For Field 3, a majority of pixels fell in the cyan class, with the exception of a small area that was classified in the yellow class. Comparison of the images reveals areas of decreased vegetation (low NDVI) correlating with the blue and green classes, and robust vegetation correlating with the cyan class. August 2007 classification of agricultural landuse in the Choptank and Corsica River watersheds: Blue = corn Green = full season soybean Brown = small grain –double crop soybean Orange = fallow (includes non-cropped, CREP, pasture, etc…) OBSTACLES INTERPRETATION red = corn light blue = soybean green = fallow red = corn light blue = soybean green = fallow red = corn yellow = winter small grains green = fallow • Need to fully integrate CLU data layer into digitization of windshield survey field boundaries • Determine of minimum needed windshield survey and inter-image compatability of endmembers • Address misclassification and handling of weeds • Increase sophistication of fallow areas analysis • Automate classification within CLU field boundaries • Allocate staff time to processing of multiple images and compilation of results This project builds upon the resources collected by the Choptank River CEAP project, including quarterly collection of satellite imagery (see SPOT image below), remote sensing of cover crop biomass, and distributed on-farm sampling. • Classification of SPOT satellite imagery based on spectral signatures derived from windshield surveys was successful (R2~77%) in accurately classifying crop type in the Choptank River watershed • This methodology can now be applied to a three-year quarterly archive of satellite images collected in the study area to derive information on crop rotation, distribution of cover crop niches, and additional environmental and agronomic factors that will assist with watershed modeling and implementation of effective conservation practices August 2006 August 2007 May 2008 Overall, Windshield survey data are collected every March and August, on approximately 300 fields in the Choptank and Corsica River watersheds, on Maryland’s Eastern Shore. Monochromatic background imagery is derived from 2005 National Aerial Imagery Program ortho-photos. Field boundaries for the windshield survey sampling areas are digitized using ArcMap, and are subsequently associated with observed crop type • Spatially distributed CROP ROTATIONS PARTNERS ANTICIPATED DELIVERABLES A: continuous corn B: corn – wheat – double crop soybean rotation C: continuous fallow (CREP or pasture) C C C • Semi-annual agricultural land use classification for the Choptank, Corsica, and Chester River watersheds • Distributed input data for watershed models • Contributions to landscape analysis of integrated watershed monitoring data • Interpretation of temporal niches for cover crops within the predominant crop rotations The authors would like to thank contributors from the University of Maryland Department of Geography, as well as ongoing collaborations with the Maryland Department of Agriculture and the USDA Natural Resources Conservation Service, as part of the ongoing Choptank River CEAP project. This project was funded in part by the USDA Conservation Effects Assessment Project (CEAP) and by a Chesapeake Bay 2006 Targeted Watersheds grant administered by the National Fish and Wildlife Foundation and the Chesapeake Bay Foundation. B B B A A A August 2006 August 2007 May 2008