Download

1 / 0
West Virginia's Smart Grid Implementation: Costs, Benefits, and Future Roadmap
0 likes | 135 Vues
The Smart Grid Interoperability Summit held on June 16, 2010, in Toronto, Canada, brought together experts to discuss the imperative of modernizing power systems. A key focus was West Virginia's Smart Grid Implementation Plan, which aims to enhance asset utilization and address the challenges faced by the power system. The discussions analyzed the costs and benefits of implementing smart grid technologies and outlined a roadmap for sustainable energy solutions in the 21st century.
Télécharger la présentation 
West Virginia's Smart Grid Implementation: Costs, Benefits, and Future Roadmap
An Image/Link below is provided (as is) to download presentation
Download Policy: Content on the Website is provided to you AS IS for your information and personal use and may not be sold / licensed / shared on other websites without getting consent from its author.
Content is provided to you AS IS for your information and personal use only.
Download presentation by click this link.
While downloading, if for some reason you are not able to download a presentation, the publisher may have deleted the file from their server.
During download, if you can't get a presentation, the file might be deleted by the publisher.
E N D
Presentation Transcript
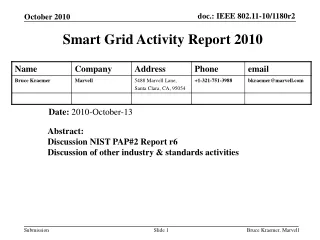
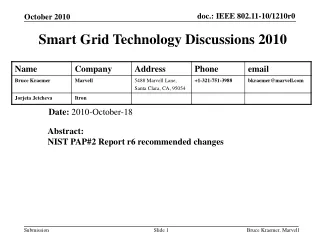
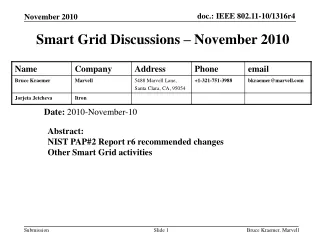
- West Virginia Smart Grid Implementation Plan Costs, Benefits, and Roadmap Smart Grid Interoperability Summit June 16, 2010 Toronto, Canada
- Today’s Discussion What is the 21st Century telling us? Asset utilization is low on power system West Virginia Smart Grid Implementation Plan High outages and coal-fired generation Results for West Virginia 5:1 benefit-to-cost to implement Smart Grid Key Lessons for the State and the Nation Portion of capital can be used for Smart Grid
-
What is the 21st Century Telling Us?
- From the 20th to the 21stCenturySubstantial Increase in Consumer Involvement 25 M residential solar 1 M PHEV/PEV 10 M PHEV/PEV 50 M PHEV/PEV 2 M architectural wind 5 M building solar 500 wind parks 50 solar parks 5,000 distributed wind 5,000 utility solar 100,000 Buildings as PP
- Sea Change in the Network Consumer engagement with resources to solve power issues locally Two-way power flow in Distribution As prices increase, local renewables will increase in residential, commercial, and industrial Imperative to transform from passive to active control in Distribution New ways for Distribution to become a Transmission resource
- Smart Grid Characteristics …the enabler The Smart Grid is “transactive” and will: Enable active participation by consumers Accommodate all generation and storage options Enable new products, services and markets Provide power quality for the digital economy Optimize asset utilization and operate efficiently Anticipate & respond to system disturbances (self-heal) Operate resiliently against attack and natural disaster Updated 02/25/2008
- Interoperability Challenges Cyber and interoperability standards Merging of legacy and Smart Grid components Technology obsolescence Network congestion Integration of variety of technologies/vendors Communications, sensors, data transmission Data management Privacy Two-way communications and power flow Updated 02/25/2008
-
West Virginia Smart Grid Implementation Plan (WV SGIP)
If you come to a fork in the road, take it. - Yogi Berra - West Virginia Smart Grid Implementation Plan Address the role of coal in Smart Grid Support economic development in State of West Virginia Only state-wide Smart Grid implementation plan completed Only second Smart Grid study to be published in the nation $540K project jointly funded by NETL, RDS, Allegheny Power, AEP, State of West Virginia, WVU, and DOE OE Results describe the approach and value proposition of implementing Smart Grid in West Virginia Cost & benefit analysis compare the state of current electricity grid and future Smart Grid in West Virginia
- WV SGIP Process Updated 02/25/2008
- Key Facts About West Virginia 991,000 electric customers (142,000 commercial and industrial) 16,500 MW of generation (90% coal-fired & 90MWh) Over 47,000 miles of distribution circuits 5,900 miles of transmission lines 58M MWh traded outside the state 32M MWh used inside the state AEP and Allegheny Energy serve 98% of the customers SAIDI (with storms) = 439 min/customer/yr National Avg SAIDI= 120 min/customer/yr SAIFI = 1.52 Storm SAIFI = 0.45 NOx = 157K T/yr SOx = 456K T/yr CO2 = 87M T/yr Updated 02/25/2008
- Generation Capacity
- Smart Grid Maturity Matrix Evaluation WV Smart Grid As-Is Principal Characteristics Aggregate Score Future State Current State Principal Characteristics Updated 02/25/2008
-
Final Results
- Proposed West Virginia Smart Grid Solutions
- Important Distinctions for WV Reductions in WV consumption go to exporting more energy 104MW of DR, doesn’t necessarily mean a reduction of generation. It likely means 104MW of increased export. More efficient delivery system (reduced line losses) means more export. Benefits from reduced WV outages is higher than most states Higher outage parameters (number and duration) are the overriding benefit potential of a WV Smart Grid Updated 02/25/2008
- WV Smart Grid Costs & Benefits Benefit to Cost Ratio for West Virginia 5:1 Benefit to Cost Ratio for San Diego 6:1 Benefit to Cost Ratio for US (EPRI, 2004) 4:1 to 5:1
- WV Benefits by Beneficiary
- WV Annual Benefits ($M)
- Total Benefits & Cost Racking
- Racking Costs & Benefits by Solution
- Implementation Plan Updated 02/25/2008
- Comparing Business As Usual to the Smart Grid Plan $ Millions Year
-
Key Lessons for West Virginia and the Nation
- Coal and Smart Grid Study Areas Baseload coal becomes larger fraction of generation Distributed coal enables high penetration of intermittent renewables Potential for coal-CHP applications Sensitivity analyses Poly-fuel and poly-products, shift in generation mix, impact of EVs, impact of utility storage, impact of proposed carbon and renewable energy legislation Updated 02/25/2008
- Conclusions Implementing a Smart Grid will: Radically improve system reliability Lower the carbon footprint Support a better sustainable business climate Generate benefits beyond the borders WV “numbers” (20-yr present value) ~ 1 million meters Total Smart Grid Cost - ~ $1.9B Total Smart Grid Benefit - ~ $10B Benefit Cost Ratio: 5:1 A Smart Grid can be implemented with a portion of the business as usual (BAU) 10-year capital plan. A WV Smart Grid benefits the regional market (others outside the state benefit greatly)
- For More Information Steve Bossart Director, Integrated Electric Power Systems Office of Systems Analysis and Planning National Energy Technology Laboratory 304-285-4643 Steven.Bossart@netl.doe.gov For additional Information: http://www.netl.doe.gov/energy-analyses/index.html 27


More Related