Download
1 / 26
270 likes | 679 Vues
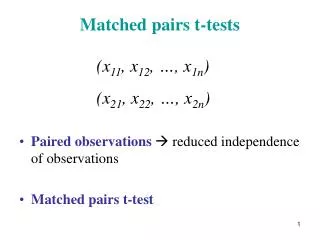
Matched t test Experimental Designs . Repeated measures Simultaneous Successive Before and after Counterbalanced Matched pairs Experimental Natural. Chapter 12. The one-way independent ANOVA An. O. Va. = Analysis of Variance. More than two groups .

E N D
Matched t testExperimental Designs • Repeated measures • Simultaneous • Successive • Before and after • Counterbalanced • Matched pairs • Experimental • Natural
Chapter 12 The one-way independent ANOVA An. O. Va. = Analysis of Variance
More than two groups • So far we have considered only one or two (sub) populations • What if there are more? • One could compare A to B, B to C, C to D etc.
Example • Three groups of manic-depressive patients are compared. • One group is given only psychotherapy, one group is given medication, and one group is given psychotherapy and medication. • After treatment, each patient is given a wellness test. • Are there differences between these treatments?
How many pairs can be derived from k levels? • This quickly gets out of hand in cases where there are many subpopulations (or groups). • If there are k populations • There are • pairs to compare. • We need another way.
One way analysis of variance • That way is the one way analysis of variance • One way = There is only one independent variable. • The independent variable is called a factor. • The factor takes on different values • Each value is called a level • Each level denotes a population • A single test compares k levels.
Another reason to use ANOVA • Suppose there is no significant difference between the k levels. • If there are k levels then there are • different combinations • So, as k increases so does the number of combinations. • Given a .05 significance level • One now has many chances to reach it and make a type I error. • Somehow this must be taken into account
So how do we develop this ANOVA ? • We want to develop a test statistic (like z or t) for the ANOVA. • We don’t know anything about it • So we must start with something we do know • Like, the t test • We will start by rewriting the t test, then generalize it to more than two levels
Generalizing the t test • sp2 is the weighted average of two variances. • Since we now have k groups or levels, we could just as easily average over k variances. • Denote as MSW • Call this generalized sp2 the mean square within = MSW • This is a pool of k variances. • The rationale for the mean square terminology is that a variance is an unbiased mean of a sum of squares. • Within refers to the fact that the variances are within each group.
Generalizing the t test • Next, for no particular reason, square both sides. • Then rearrange. • So, how do we compute MSW?
Generalizing the t test • For equal sized groups, MSW is simply the average of each group’s variance.
Generalizing the t test • Next generalize the numerator • It is a measure of the difference between the means • However, we can’t subtract k things • But, a difference is also a measure of spread • We need a measure of spread that can be applied to k things • This might be…?
Generalizing the t test • We will use the variance • Replace n times the difference of means with n times a variance of means • Call this variance the mean squares between = MSbet
Large or small? • t2 : should it be large or small? • MSbet: should it be large or small? 2 reasons • MSW: should to be large or small? 2 reasons 0
Give t2 a new name • t2 will be called the F-ratio. • F has a distribution that can be used in a way, similar to, the way we use the normal distribution. • How does this distribution differ from the normal and t distributions? • Mode can’t be 0. • Symmetry • Tails • Is a one tailed in the graph. • Like two tailed test in terms of directionality. 0
F ratiothe numerator • The numerator is the actually the variance of the general population! • Recall the definition of the standard error (which assumes that the null hypothesis is true).
F ratioInterpretaion • What happens if the null hypothesis is not true?
F ratioInterpretaion • Look at the formula for the variance of the mean • If the null hypothesis is not true, then the differences can be arbitrarily large, depending on the differences between the subpopulations.
F ratioInterpretaion • MSbet and MSW behave differently • In the bottom figure, spreading of the means has an effect (increase) on F numerator, but has no effect on the denominator • So, if the null hypothesis is not true, F is …?
F ratioFormula • .
ExampleComputing the F ratio • Three groups of manic-depressive patients are compared. • One group is given only psychotherapy, one group is given medication, and one group is given psychotherapy and medication. • Each group has 50 individuals. • After treatment, each patient is given a wellness test.
ExampleComputing the F ratio • Plug and chug. • But we are still missing the mean of the group means.
ExampleComputing the F ratio • The mean of group means is easy to compute. • Plug it in and do the arithmetic. • Now we need a Fcrit.
F ratioDegrees of freedom • Like the t test, the shape of the F distribution depends on df • There are two • dfbet = k-1=3-1=2 • dfW = NT-k = 150 - 3 = 147
F distributionthe tables • Since there are two df, there will be many combinations • Hence, the tables are limited to a few levels • One per table • See tables A7, A8, A9 • Let’s use =.05 • Table A7 gives ______ • Compare Fcrit to F.
Exercises • Page 334 • 1,2,3,5,6,7