Download
1 / 26
260 likes | 432 Vues
NATURAL GAS MARKET OUTLOOK 2010. Natural Gas Outlook. Import share of natural gas supply declines as domestic supply grows Shale gas has been the primary source of recent growth in U.S. recoverable natural gas resources California LNG projects uncertainty

E N D
Natural Gas Outlook • Import share of natural gas supply declines as domestic supply grows • Shale gas has been the primary source of recent growth in U.S. recoverable natural gas resources • California LNG projects uncertainty • U.S. storage at high levels this winter • Economy starting recovery • U.S. gas-fired electric generation expected to grow • Future prices increase with economic recovery
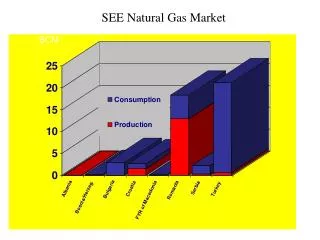
Import share of natural gas supply declines as domestic supply grows trillion cubic feet History Projections 6% Consumption 2% 13% Net imports Domestic supply AEO2010 reference case Updated AEO2009 reference case Source: Annual Energy Outlook 2010
Shale gas has been the primary source of recent growth in U.S. technically recoverable natural gas resources trillion cubic feet Unproved shale gas & other unconventional Unproved conventional (including Alaska*) Proved reserves (all types & locations) * Alaska resource estimates prior to AEO2009 reflect resources from the North Slope that were not included in previously published documentation. Source: U.S. Geological Service, Mineral Management Service, private data, and EIA.
Shale gas and Alaska production offset declines in supply to meet consumption growth and lower import needs trillion cubic feet History Projections Alaska Shale gas Coalbed methane Non-associated onshore Non-associated offshore Associated with oil Net imports Source: Annual Energy Outlook 2010
Max Count Min Count Marcellus Barnett Woodford Haynesville Fayetteville Horizontal shale gas rig counts slowed, but have rebounded Source: Smith International
Production in key gas shale plays is growing rapidly Billion cubic meters *Estimated Source: Energy Information Administration and Lippmann Consulting, Inc.
SoCalGas Sources of Natural Gas SoCalGas Total Supply Mix for 2008 Source: California Gas Report, SoCalGas 2009
Start-Up of Costa Azul LNG Terminal • Start-up testing of 1 Bcf/d Costa Azul LNG terminal occurred in May 2008 • Terminal received two cargos for start-up supplies • Terminal had to complete performance test by running at 1 Bcf/d and peak 1.3 Bcf/d capacity • Costa Azul supplies delivered to SoCalGas/SDG&E system through new Otay Mesa receipt point and at Blythe through new North Baja pipeline • Costa Azul terminal declared operational on May 15, 2008 • Terminal expandable to 2.5 Bcf/d
Costa Azul Start Up Monitoring Results • LNG supplies just another source of gas supply – like we currently receive from California, Southwest, Rocky Mountains or Canada • Utilities didn’t expect any customer equipment performance issues with introduction of LNG supplies, but conducted LNG Roll-Out Plan during Costa Azul start-up to assess how commercial/industrial end-use equipment responded to changes in gas quality • Costa Azul Start Up Monitoring Project Results • Validated Prior Studies and Testing • SDG&E and SDCAPCD monitored and collected information for key end use equipment: • Electric Generation and Co-generation • Gas Engines • Boilers • Residential Equipment (Monitoring) • No significant issues were encountered; equipment performance exceeded expectations in certain cases
Future Expectations for Costa Azul • Expectations of future deliveries from Costa Azul remain uncertain • Costa Azul capacity split 500 MMcfd each to Sempra LNG and Shell – However, Shell recently completed a “subleasing” deal with Gazprom for a quarter of the capacity • Sempra’s long-term supplies from Tangguh project in Indonesia • Shell has available capacity now - long-term supplies from Sakhalin project in Russia – No cargoes are anticipated until early next year because of languishing prices here • Current spot market not favorable to near-term Costa Azul deliveries • 2008 US LNG imports down significantly from 2007 – trend could change with additional LNG production due online in 2009 . • Some cargos to Costa Azul will be needed regardless of price to maintain terminal – One maintenance cargo has already been received by the terminal in August 2009
Clearwater Woodside Esperanza SLNG Corp
California LNG Projects • Clearwater LNG Project • No current timetable for issuing draft environmental impact report for the project • The federal licensing clock has apparently stopped as the U.S. Coast Guard had sent the applicant a list of 396 questions • Woodside Project • In January 2009, Woodside announced that it was shelving plans due to “changed energy market conditions.” • Port Esperanza Project • Yet to file formal Deepwater Port Application so project future uncertain.
Natural gas and renewables account for the majority of capacity additions from 2008 to 2035 2008 capacity Capacity additions 2008 to 2035 Hydropower* 99 (10%) Hydropower* 1 (0.4%) Nuclear 8 (3%) Coal 312 (31%) Coal 31 (12%) Nuclear 101 (10%) Other renewables 92 (37%) Other renewables 40 (4%) 250 gigawatts 1,008 gigawatts Other 119 (12%) Other 2 (1%) Natural gas 116 (46%) Natural gas 338 (33%) * Includes pumped storage 17 Source: Annual Energy Outlook 2010
Winter 2009/10 Weather has the most impact on spot natural gas prices.
While Gas Prices Have Fluctuated;SoCalGas’ Transportation Costs Have Been Flat Transport costs are the Volumetric & Customer Charge. Core GN10 @ 100,000th/year and Noncore GTF/I3-D @ 1.5MMth/year. Core Gas Cost is SCG’s core procurement rate and CA Border Index is Natural Gas Intelligence Index
Natural gas wellhead price is projected to rise from low levels experienced during 2008-2009 recession 2008 dollars per thousand cubic feet History Projections AEO2010 reference case Updated AEO2009 reference case 23 Source: Annual Energy Outlook 2010
North American Natural Gas Market • High levels of gas price volatility will likely continue. • Shale gas drives growth in natural gas production and reduces reliance on imported gas. • Higher demand expected for U.S. gas fired electric generation. • Natural gas prices projected to rise with economic recovery.
What Can You Do to Manage Energy Costs? • Take advantage of energy efficiency programs. Call your Account Executive for technical support. • Go to socalgas.com/business for support tools. • If you transport your own gas, talk to your gas supplier to discuss supply and pricing strategies. • Look for ways to conserve and be more energy efficient.