Case Study on Coastal wetlands
480 likes | 698 Vues
Case Study on Coastal wetlands. Françoise Breton (ETC-TE) Expert meeting on Land use and ecosystem accounting 18-19 May 2006. Index. 1.Wetlands and the coast 2.Wetland accounting : main objectives 3.Wetland diagnosis. Main symptoms Crucial limits (Global) Local limits

Case Study on Coastal wetlands
E N D
Presentation Transcript
Case Study on Coastal wetlands Françoise Breton (ETC-TE) Expert meeting on Land use and ecosystem accounting 18-19 May 2006
Index • 1.Wetlands and the coast • 2.Wetland accounting : main objectives • 3.Wetland diagnosis. Main symptoms • Crucial limits (Global) • Local limits markers • 4.Wetland functions (Goods and services). How to orient land use accounting • Suporting primary production • Provisioning • Regulating: climate and floods/desease regulation • 5. Accounting for wetlands: some directions
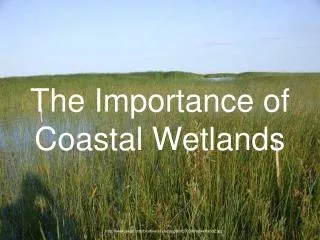
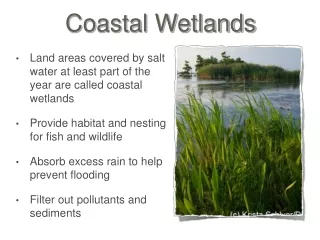
1.Wetlands and the coast An integrated assessment based on land accounting...
Strong wetland loss in the Atlantic coast :↑artificialisation, arable land and forest↓ pastures, mixt agriculture, grasslands, wetlands
...urban land take and increase are more important in the 1st km Figure 4 Change of built-up areas in 0–10 km and 0–1 km coastal zones Source: ETC-TE
...nature protection which is mostly concentrated on the 1st km of coast... Figure 11 Distribution of NATURA 2000 sites in coastal zone by 1 km bands from the coastline and in the marine 10 km zone (blue) Source: ETC-TE and ETC-BD/ EEA. 2005, based on Natura2000 database
Other data to account for vulnérabilityof coastal systems 12% of the EU coastal zones are under 5 m elevation and are potentiallyvulnerable to the sea level rise and associated floods The EU coastal regions (NUTS3) have140 millions inhabitants, or 46.5% of the total polulation of the coastal countries.
2. Wetland accounting : main objectives • Principles of health ecosystem: theory of Ecosystem Distress Syndrome • Reflexion: Most important elements for diagnosis? relevant information? HOW TO SELECT THE MARKERS AND WHICH MARKERS FOR WETLANDS • First diagnostic approach: probabilistic at global level • Global limits for wetland sustainability? • Sediment availability • SLR • Fuzzy ensembles • Second approach: Which items to be looked at locally? • Related with life functions: disorder in the nutrient chain, capacity to fix carbon… • Disorganisation of the the ecosystems pattern: Fragmentation, change in patch size, hydric stress, intoxication(bad functioning) • Composition in species: opportunist character, invasion of commune species, loss of endemic species
3. Wetland diagnosis. Main symptoms (I): Crucial limits (Regional) 3.1. Sediment availability
Annual déficit of 100 Mt Contribute to the erosion dynamic The role of dams…
Dams are signicative obstacles. 6103 bigdamsare inventoried in EEA countriesand fragment rivers… Base 1975 1925 1950 2000 1900 Dams as a barrier to sediment fluxes
Bayside Effects Sediment availability as a marker
Data need for the coastal interface • Risques • perte biodiversite, • inondations, • élévation du niveau de la mer, • prevention tsunami • Securité des littoraux. • Freiner construction de l’urbaindiffusinfrastructures nouveaux pays et leur effet • Assurer espaces naturels tampons espaces littoraux encore non touchés +assurer continuité processus littoraux • Gérer usages de la mer et de laplateforme
Water Framework Directive Watershed management, water bodies Continental waters Base line 1Nautic MileWFD Territorial waters Limitterritorial waters (4-12 nm) Directive/ Marine Strategy Marine sub-regions Juridictional waters Emergent marine policies -UE Limit Exclusive Economic Zone Integration of EU policies in coastal zones :River catchments, marine and coastal zones ICZM Recommendation Chemical status Deep sea
3. Wetland diagnosis. Main symptoms (II): crucial limits (global/regional) 3.2. Sea Level Rise Intergovernmental Panel on Climate Change Assessment Reports1990, 1995, 2001, 200_ Scientific Basis Impacts, Adaptation, and Vulnerability Mitigation
Wetland Loss - Negative Sediment Budget - Sea-Level Rise Water surface: more water, less sediments
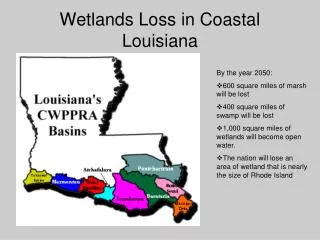
Some numbers for Spain • In Spain : scenario 2050 • SLR expected: 4 mm/year 4/5 cm more each 10 years • Wave high: between 20 and 50 % more more erosion • Loss of beaches between 20 and 70 meters • WETLANDS will be also most affected: Ebro Delta Doñana coastal marshes Manga del Mar menor will desappear See: Report on Climate change in Spain, MMA
4.1.1. Inland marshes Total 2000: 31.999 Ha 90-00: +139 Ha (56 Ha from 2.4.3.; and 83 Ha from water bodies) 4.2.1. Salt marshes Total 2000: 865 Ha 90-00: no change 4.2.2 Salines Total 2000: 4.978 Ha 90-00: + 54 Ha from inland marshes Wetlands at local scale: Basic stocks/flows accounts : No major changes INSIDE because of protection statusMajor changes around, land wards & seawards (SLR) Importance of contextual system & connectivity.
Counts of distress symptoms: some markers for Doñana diagnosis.Ecosystem integrity/diversity (local) • Birds • Wetlands with water in summer (al least 50 cm water depth) • Salination • presence of flamingos
Counts of distress symptoms: some markers for Doñana diagnosis.Ecosystem integrity/diversity(local+ regional) • Over exploiting of ground water aquifers In agriculture areas around Doñana excessive amounts of water have been/are extracted to cater for the tourist industry and irrigation, specially for cotton and rice • Stats on water consumption • Toxic cyanobacteria/algae bloom (inside Doñana) • high bird mortality. Monitoring. Related with intensive • agriculture inputs around Doñana. • Exotic species • monitoring of exotic species in diff. Sites in and around Doñana (in grids)
Marker for diagnosis: Wetlands temperature (building pressure) • Wetlands temperature . Smoothing
4.Wetland functions (Goods and services). How to orient land use accounting ? Ref to Millennium Ecosystem Assessment:
Supporting primary production Shallow water seagrass beds are vanishing • Seagrass beds are in decline around the world, scientist Frederick Short says. With these underwater meadows also commercially valuable shellfish and fish, waterfowl and other wildlife are disappearing,while water quality declines and erosion prevention decreases. • Seagrass beds serve as protective nurseries for juvenile fish and shellfish, a habitat for many marine species, and a feeding ground for predatory fish, waterfowl and large sea creatures like manatees and sea turtles. According to Short the disappearance of seagrass beds will have a major impact. • Fishing communities are threatened in their existence. See: www.ens-newswire.com/ens/mar2006/2006-03-28-03.asp www.seagrassnet.org data on shallow water benthic communities (IFREMER project) - Catches statistics
(courtesy Danube Delta National Institute) Provisioning • Inserting in grid: • Agricultural stats • Aquaculture stats • Forestry stats • Frequentation stats • Tourism, hunting, recreational fishing…
adaptationcapacity (wetlands as buffer zones) impacts Vulnerability (settlements + populations) Regulating climate and floods exposition sensibility 12% of EU coastal zones haveless than 5 m elevation and arepotentialy vulnerable to Sea Level Rise and associated floodings Statistics on capital & human at risk/scenarios
-Insurance statistics for estimate value goods, infrastructures and people loss -flood events (places and water levels)
Desease regulation Restoration of wetlands is key to reducing future threats of avian flu • Restoring tens of thousands of lost and degraded wetlands could go a long way towards reducing the threat of avian flu pandemics a new report published on April 11th says. • The loss of wetlands around the globe is forcing many wild birds onto alternative sites like farm ponds and paddy fields, bringing them into direct contact with chickens, ducks, geese, and other domesticated fowl. Close contact of wild birds and poultry species is believed to be a major cause behind the spread of avian influenza. • The report has been commissioned by the United Nations Environment Programme (UNEP) from a team led by leading Canadian academic Dr David Rapport. www.unep.org/Documents.Multilingual/Default.asp?DocumentID=475&ArticleID=5255&l=en -routes and number of migrating birds • Stocks of wetlands and main areas of bird habitats (winter/summer) • Agriculture and poultry raising areas near wetlands (tº)
5. Accounting for wetlands: some directions • How many, how much? (land cover units, small ecosystems, rivers, biomass, water...) • At the face of global change (sediment availability/SLR) • At local scale • In which state/health? (¤ homeostasis ¤ resilience ¤ modification process with no return ¤ collapsus)(global first/local) • Which supply of goods and services? (availability and use) (local first/global) • What are the stresses and stressors? (the responsible sectors) (global first/local) • Wealth and other values, the Natural Capital CLC as common reference Scale matters!
Wetlands in Corine land cover • NB: • Rice fields can be isolated as well and added to the list above • CLC maps landscape units > 25 ha and broder than 100 m small wetlands can be found in other CLC classes, in particular in mosaics of agricuture and nature
Selection of CLC classes for wetlands • 2.1.3 Rice fields (good extraction of rice fields in CLC) • 4 • 4.1.1 Inland marshes • 4.1.2 peat bogs • 4.2.1 Salt marshes • 4.2.2 Salines • 4.2.3 Intertidal flats • 5 • 5.1.1 Water courses (?) • 5.1.2 Water bodies • 5.2.1 Coastal lagoons • 5.2.2 Estuaries • 5.2.3 Sea and ocean (NO)
Global Counts of wetland integrity Wetcoastlis: Coastal wetland intensity versus wave high previsions versus storms/surge previsions Coastal wetland intensity versus nature protection intensity versus urban and agriculture (wetland temperature)
Regional accounts: Example Ongoing studies in New Jersey: -Impacts to 2025 -Impacts to 2095 http://www.epa.gov/globalwarming/publications/impacts/sealevel/maps/maps.html
Wetlands Elements of diagnosis : markers. Extreme vulnerability of the system : Urban sprawl in the province of Venice, 1990-2000, cells of 1 km x 1 km – wetlands in the background: Despite possible threats from sea level rise and the permanent ecological problems of the lagoon due to agriculture eutrophication surpluses, urban and infrastructures development has continued in the province of Venice.