
Abstract
Intensity Distribution. R*. R. Top PDMS wall. Z. Y. 17 m m. O. |R| 2 O. Gallery of E . coli Trajectories (Quiescent Flow ). R 2 O*. Abstract

Abstract
E N D
Presentation Transcript
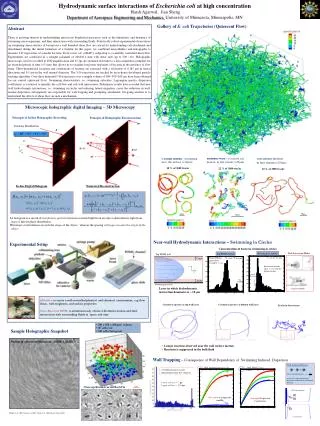
Intensity Distribution R* R Top PDMS wall Z Y 17 mm O |R|2O Gallery of E. coliTrajectories (Quiescent Flow) R2O* Abstract • There is growing interest in understanding microscale biophysical processes such as the kinematics and dynamics of swimming microorganisms, and their interactions with surrounding fluids. Statistically robust experimental observations on swimming characteristics of bacteria in a wall bounded shear flow are crucial for understanding cell attachment and detachment during the initial formation of a biofilm. In this paper, we combined microfluidics and holography to measure 3-D trajectories of a model bacteria, Escherichia coli (AW405), subjecting to a carefully controlled shear flow. Experiments are conducted in a straight mchannel of 40x3x0.2 mm with shear rates up to 200 (1/s). Holographic microscopic movies recorded at 40X magnification and 15 fps are streamed real-time to a data acquisition computer for an extended period of time (>5 min) that allows us to examine long term responses of bacteria in the presence of flow shear. Three-dimensional locations and orientations of bacteria are extracted with a resolution of 0.185 μm in lateral directions and 0.5 μm in the wall normal direction. The 3-D trajectories are tracked by an in-house developed particle tracking algorithm. Over three thousand 3-D trajectories over a sample volume of 380×380×200 μm have been obtained for our control (quiescent flow). Swimming characteristics, i.e. swimming velocities, Lagrangian spectra, dispersion coefficients, is extracted to quantify the cell-flow and cell-wall interactions. Preliminary results have revealed that near wall hydrodynamic interactions, i.e. swimming in circles and reducing lateral migration, cause the reduction in wall-normal dispersion, subsequently are responsible for wall trapping and prompting attachment. On-going analysis is to understand the effects of shear flow on such a mechanism. Cell Concentration mfluidics 12 mm Bottom glass wall Layer in which hydrodynamic interaction dominates is ~ 10 mm Channel Depth Microscopic holographic digital Imaging – 3D Microscopy Principle of In-line Holographic Recording Principle of Holographic Reconstruction Hydrodynamic surface interactions of Escherichia coli at high concentration Harsh Agarwal, Jian Sheng Department of Aerospace Engineering and Mechanics, University of Minnesota, Minneapolis, MN Determined motions in free stream (>25mm) Random Walk - Localized cell motion in free stream (>25mm) Circular motion - Swimming near the surface (<10mm) 10 % of 3000 tracks 22 % of 3000 tracks 43 % of 3000 tracks In-line Digital Hologram Numerical Reconstruction 10mm 50mm 10mm • A hologram is a record of interference patterns between scattered light from an object and reference light from laser of known phase distribution • Envelope of interference records the shape of the object, whereas the spacing of fringes encodes the origin of the object Experimental Setup Near-wall Hydrodynamic Interactions – Swimming in Circles Concentration of bacteria swimming in circles Bottom glass surface Wall Interaction Model Top PDMS surface z = 12.6 ± 7.2 mm Hydrodynamic interactions extend to 17 mm z = 199.7 ± 6.6 mm Interaction extends up to 12 mmfrom the bottom surface *Lauga et al.(2006) Bottom z = 7 mm mFluidics: to create a well-controlled physical and chemical environment, e.g. flow shear, wall roughness, and surface properties Time-Resolved DHM: to simultaneously obtain 3-D cellular motion and their interactions with surrounding fluids in space and time Top z=210mm ~10 folds increase in cell concentration near the surfaces Circular trajectory at top wall layer Circular trajectory at bottom wall layer Tracks in free stream Lower wall at z = 7 mm Upper wall at z = 210 mm • 380 x 380 x 200 mm3 volume • 107 cells/ml • 350 cells/hologram Sample Holographic Snapshot Portion of subtracted Hologram (2048K x2048K) • Longer run time observed near the wall surface motion • Run time is suppressed in the bulk fluid Wall Trapping Layer (z ≤ 15) Bulk Fluid (15 ≤z ≤ 100) Dxx Wall Trapping – Consequence of Wall Dependency of Swimming Induced Dispersion Dyy 3D Particle Locations 2mm Close-up Reconstructed Bacteria One order of magnitude smaller Isotropic Dispersion Coefficients Dzz Wall normal diffusion where wall normal flux, is caused by spatial gradient of dispersion coefficient in wall normal direction. Malkeil et al. 2003, Sheng et. al 2006, Sheng et al. 2007, Katz & Sheng 2010


