Statistical Testing: Comparing Two Means and Proportions
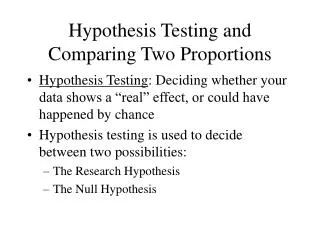
Learn hypothesis testing for differences in two independent sample means and proportions with examples. Understand test statistics and interpreting results.

Statistical Testing: Comparing Two Means and Proportions
E N D
Presentation Transcript
Chapter 9: Hypothesis Testing Section 7: Testing Differences of Two Means or Two Proportions (Independent Samples)
Large Samples (Independent) • Test Statistic
Test Statistic • , as stated in the null hypothesis • = sample mean of data • = sample mean of data • = standard deviation of data • = standard deviation of data • = sample size of data • = sample size of data
Example • A consumer group is testing camp stoves. To test the heating capacity of a stove, they measure the time required to bring 2 quarts of water from 50°F to boiling. Two competing models are under consideration Thirty-six stoves of each model were tested and the following results are obtained. • Model 1: = 11.4 and = 2.5 • Model 2: = 9.9 and = 3 • Is there any difference between the performances of these two models? Use a 5% level of significance and find the p-value.
Small Samples (Independent) • Test Statistic • df = n1 + n2 – 2
Example • Two competing headache remedies claim to give fast-acting relief. An experiment was performed to compare the mean lengths of times required for bodily absorption of brand A and brand B headache remedies. Groups were randomly selected to use the remedies. Results (in minutes) are as follows:
Example Brand ABrand B n1 = 12 n2 = 12 = 20.1 = 18.9 s1 = 8.7 s2 = 7.5 • Use a 5% level of significance to test the claim that there is no difference in the mean times required for bodily absorption.
Proportions • Test Statistic
Example • In order to improve voter registration, reminders are sent in the mail to citizens who are eligible to register. To determine if this method will improve voter registration, two groups are used in a study. In the first group of 625 people, no reminders are sent and 295 registered. In the second group of 625 people, reminders are sent and 350 registered. The county clerk claims that the proportion of people to register was significantly greater in the second group. Use a 5% level of significance to test the claim.