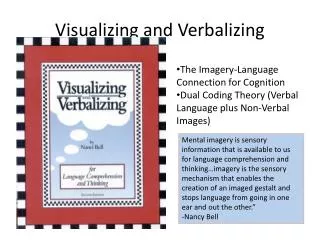
Visualizing Conversations, Social Networks & Blogs
530 likes | 736 Vues
Visualizing Conversations, Social Networks & Blogs. Arthur Law, Egon Pasztor, Sean Savage, Zhanna Shamis, Amy Todenhagen IS247 Information Visualization April 7, 2004. Conversations. Online Conversation Tools. Text-only chat environments – problems:

Visualizing Conversations, Social Networks & Blogs
E N D
Presentation Transcript
Visualizing Conversations, Social Networks & Blogs Arthur Law, Egon Pasztor, Sean Savage, Zhanna Shamis, Amy Todenhagen IS247 Information Visualization April 7, 2004
Online Conversation Tools Text-only chat environments – problems: • Ephemeral presence – hard to determine who is participating • Everyone looks the same – “usernames in text” are all visually similar • Interactions among users not well represented • Turn-taking, timing information not well represented. Avatar-based systems: • Solves the problem of presence – but usually only in a binary way • People look different – but avatars can distort emotions if they provide only a small range of broadly-drawn expressions. • The screen can get cluttered – and less history can be on screen at once • Turn-taking rhythms still difficult to convey
Online Conversation Tools: Babble - IBM Research 2000 Thomas Erickson Chat program with a “Social Proxy” graphic, containing colored marbles for each user. • Marbles move to the center when they speak, drift to the periphery when idle for minutes. • Marbles leave the circle when they enter a private conversation • Marble motion catches the eye, triggers interactions Also, in private conversations, there’s a real-time transfer of click sounds representing typing!
Online Conversation Tools: Chat Circles - MIT Media Lab 1999 Judith Donath Users represented by a colored circle • Circle size indicates how much the user is talking • Lurkers shrink to a dot, dominant speakers grow • Presence always visible • Groups with “Hearing Range” • User only sees the words of those near him. • User can move his circle to other groups, position himself nearest friends, etc. Also, there’s a History View, since very little history is visible in the main view:
Online Conversation Tools: Flow Chat - Microsoft Research 1999 David Vronay Chat program with temporal flow represented explicitly with horizontal scrolling timeline • Each participant gets a row, and the horizontal dimension is time, continuously scrolling. • Message-box placement shows the time the user began and ended typing. • A message-box in progress is shown updating in real time, in a light-yellow color. It changes to the permanent color when the user hits Enter. • The user can scroll the pane backward to see messages which have flowed off the screen. Results: People were embarrassed to have their poor typing skills on display, and the large continuously scrolling window caused vertigo sensations. While users could scroll the pane back in time to see information that had left, they generally didn’t, and repeated questions instead...
Online Conversation Tools: Threaded Chats - Microsoft Research 2000 Marc Smith Chat program with turn-taking represented explicitly in a hierarchical tree-view • Users click on the line to which they want to reply • “Turn in progress” box visible to all. • So text can appear at any point in the hierarchy -- It doesn’t scroll in from the bottom. Results: It was very difficult to follow group interaction, as there was no single point of focus. However, it was easy to “catch-up” with a single topic. Also, the bottom shows who is present and their degree of interactivity, in a table format: http://citeseer.ist.psu.edu/smith00conversation.html
Online Conversation Tools: Conversation Thumbnails – IBM Research 2003 Martin Wattenberg Program emphasizes searching and browsing a long conversation prior to replying • Zoomed out view shows the shape of the entire structure. Mouse-over shows the actual text. • Fast browsing -- Zoomed out view shows the shape of the entire conversation tree. Mouse-over shows the actual text. • Color represents message importance; users may rate other people’s messages. • As a new message is entered, arrows show messages with similar words – encouraging the author to stop and read. • Cuts down on duplicate ideas.
Online Conversation Tools: Grand Central - Microsoft Research 2003 Gina Venolia • Interface for conversations over email
Online Conversation Tools: Conversation Space 1999 Dimitri Popolov Program emphasizes branching structure of online discussions “... communications that start on a particular topic might lead in many different directions before the discussion is done .. because the mechanics of Internet response do not require turn-taking. From the oral side, it is as if everyone who is interested in talking can all jump in at once, but still their individual voices can be clearly heard.” • Free-form 2D layout, of messages linked to each other.. • Closer to wiki mentality than “linear” chat.. -- Shank & Cunningham; Philosophical Perspectives on Computer Mediated Communication
Online Conversation Tools: Comic Chat - Microsoft 1996 David Kurlander Like other IRC chat clients, you type text to communicate. You can also select an emotion using an emotion control. The chat is rendered as a cartoon, controlled by keywords in the text. • Greetings: Hi, hello, bye, etc – character waves. • Pointing: I or you at beginning of sentence – character points at himself or other. • Character looks at intended recipient of utterance, deduced from text or manually selected. Recipient appears in the same panel. • Probabilistically, some panels zoom on a character.
Online Conversation Tools: There.com Avatar-based chat program • Real-time 3D experience -- Video-Game like • The environment provides scenarios for interaction • “Selecting an outfit” and “exploring the world” are as important as talking • Emphasis on interactivity, no history or archiving • “Comic chat” plus “The Sims”
Conversations: Observing Microsoft Research Netscan • Usenet Hierarchy Treemap http://netscan.research.microsoft.com/treemap/ Source: http://netscan.research.microsoft.com/treemap/
Conversations: Observing MSR Netscan Group Crosspost Visualization Source: http://netscan.research.microsoft.com/Static/crosspostVz.asp?
B A C D Conversations: Observing MSR Netscan: Message Thread Dashboard • Everything here pertains to a single message thread • A: Thread tree • B: “Piano Roll” • C: Interpersonal Connections chart • D: Message pane http://www.furrygoat.com/Pictures/Misc/BlogTreeMap-Large.gif Source: www.research.microsoft.com/~masmith/Visualization%20Components%20for%20Persistent%20Conversations%20-%20Final.doc
Conversations: Observing MSR Netscan: Thread trees • Vertical bands: 1 band = 1 day • Band shading: darker = farther in the past
Conversations: Observing MSR Netscan: Piano Rolls Shows each author’s participation in a thread, by total posts and by posts per day of thread’s life Source: www.research.microsoft.com/~masmith/Visualization%20Components%20for%20Persistent%20Conversations%20-%20Final.doc
Conversations: Observing MSR Netscan: Interpersonal Connections Circles = authors Edges = replies (thicker = more replies) Red = from selected author Green = to selected author Source: www.research.microsoft.com/~masmith/Visualization%20Components%20for%20Persistent%20Conversations%20-%20Final.doc
Conversations: Observing A Flower = 1 user A Petal = 1 interaction Stem length = time participating PeopleGarden: Showing People’s Participation A group with balanced participation A group with a dominant voice Source: http://smg.media.mit.edu/papers/Xiong/pgarden_uist99.pdf
Conversations: Observing PeopleGarden: Showing People’s Participation Petals = messages: increases as more messages are posted Petal placement = message sequence: older petals move to the left Petal saturation = message age: petals fade over time. Source: http://smg.media.mit.edu/papers/Xiong/pgarden_uist99.pdf
Conversations: Observing PeopleGarden: Feedback Pistils = responses: each denotes a response to the post (petal) it’s attached to Three users with the same amount of postings over different durations, With different amounts of responses. Source: http://smg.media.mit.edu/papers/Xiong/pgarden_uist99.pdf
Conversations: Observing Loom: Authors and Threads comp.lang.java.gui soc.culture.greek Source: http://smg.media.mit.edu/papers/Donath/VisualConv/VisualConv.HICSS.html#pgfId=1002047
Conversations: Observing Loom: Mood of Conversation Each dot = 1 posting Red dots = “angry” postings Source: http://smg.media.mit.edu/papers/Donath/VisualConv/VisualConv.HICSS.html#pgfId=1002047Ongoing work (Loom2): http://smg.media.mit.edu/projects/loom2/computationalSketches/index.html
Visualizing Blogs Basic Terminology • Inbound/Outbound Link - Links to/from your site. • Inbound/Outbound blogs - Sites blogrolling you and you blogrolling them. • Blogroll - List of fairly permanent links to your favorite blogs/sites. • RSS - An XML format used for syndicating news or news like content. Many Weblogs make content available in RSS. Source: Mary Hodder & Google
Visualizing Blogs RSS Tree Maps • Each RSS Feed has its own Rectangle. • The size of each rectangle depends on number of entries in an RSS feed. • Each RSS entry is a nested rectangle in an RSS feed rectangle. • The size of each RSS entry corresponds to its textual length. • Color represents how recent the post is. Along a color continuum, yellow represents the most recent posts and blue represents the oldest posts. For example, a yellow block may be a day old, a white block a week old, and a blue block two weeks old. http://www.furrygoat.com/Pictures/Misc/BlogTreeMap-Large.gif Source: http://www.furrygoat.com/archives/000812.html
Visualizing Blogs Blog Neighborhood • Maps the social network of blogs by grouping together blogs of a similar nature. • Similar nature is defined as who you blogroll and who blogrolls you. http://www.blogstreet.com/visualneighborhood.html Source: http://www.blogstreet.com/visualneighborhood.html
Visualizing Blogs Blog Genealogy • Data set from BlogTree.com • You Register blogs that inspired the creation of your blog (Your Parents) • Others register your blog as a blog that inspired the creation of their blog (Your Children) • Others register a blog that inspired the creation of their blog and it happens to be one that inspired the creation of your blog (Your Siblings) • Dave Winer’s blog Scripting News is in the center. Lines radiate out from inspirer to inspiree. • Larger text indicates greater number of descendants. • Related Visualizations http://radio.weblogs.com/0104369/stories/2003/11/02/wiener.png http://radio.weblogs.com/0104369/stories/2003/11/02/invis2pCrop2.png http://radio.weblogs.com/0104369/stories/2003/11/02/fisheye.jpg Source: http://radio.weblogs.com/0104369/stories/2003/11/10/visualizationOfBlogspace.html
Visualizing Blogs Blog Genealogy • Focal node, Robot Wisdom weblog, is in red. Its descendants branch out in a more traditional tree structure. • Childless blogs represented in triangular clumps. • Don’t know what color and line thickness suggest? http://radio.weblogs.com/0104369/stories/2003/11/02/s133.jpg Source: http://radio.weblogs.com/0104369/stories/2003/11/10/visualizationOfBlogspace.html
Visualizing Blogs Technorati Rankings • Rankings based on number of references pointing to a weblog. The larger the title text the greater the rank. • Width of each line represents the number of blogs at a particular rank with consideration given to the number of inbound links. • Related Visualization: http://www.technorati.com/blogpower.html http://www.technorati.com/bloglinks.html Source: http://www.technorati.com/blogpower.html
Visualizing Blogs Blog Map of DC Area • Bloggers in the DC area arranged by metro station • The most bloggish stations are Vienna, Dupont Circle, and Silver Spring, but you can’t tell that just by looking at the map. You have to mouse over the station. http://www.reenhead.com/map/metroblogmap.html Source: http://www.technorati.com/blogpower.html
Visualizing Blogs Influential Blogs • Depicts blogs that have had the most influence on the media. • These blogs are either focused on the business of media, current events, or politics. They cover the media or have been covered by the media. • The bigger the mouth, the more influential blog. • Position of mouth shows: • Political orientation (left or right) • Whether blog is doing more blogging (top), or more journalism (bottom). "More blogging" means a focus on linking, summarizing and quips. "More journalism" means more original commentary, reporting, and perhaps a journalism background http://www.ojr.org/ojr/uploads/1056011147.htm Source: http://www.ojr.org/ojr/glaser/1056050270.php
Social Network Visualization Definition: • the mapping and measuring of relationships and flows between people, groups, organizations, computers or other information/knowledge processing entities. • Nodes in the network represent people or groups. • The links show the relationships or flows between nodes. Source: http://www.orgnet.com/sna
Social Network Visualization Goals of Social Network Visualization • To understand networks and their participants • Evaluate the location of actors in the network • Determine the importance, or prominence, of a node in the network. Source: http://www.orgnet.com/sna
Social Network Visualization Social Network Analysis • Degrees: the number of direct connections a node has. • Common wisdom in personal networks is "the more connections, the better." • This is not always so. What really matters is where those connections lead to -- and how they connect to other connected nodes • Betweenness: if someone is between two important constituencies. • 'Broker' role in the network • Powerful role in the network • Can be single point of failure. • A node with high betweenness has great influence over what flows in the network. Source: http://www.orgnet.com/sna
Social Network Visualization Social Network Analysis, cont. • Closeness: the pattern of direct and indirect ties that allow access all the nodes in the network more quickly than anyone else • A node with high closeness is an excellent position to monitor the information flow in the network and has the best visibility into what is happening in the network. • Social groups: collections of actors who are closely linked to each other • Social positions: sets of actors who are linked into the total social system in similar ways Source: http://www.orgnet.com/sna
Social Network Visualization Visualization • Two distinct forms • Points and lines: points represent social actors and the lines represent connections among the actors • Most common • Matrices: the rows and columns both represent social actors and numbers or symbols in the cells show the social connections linking those actors From Kremple http://www.mpi-fg-koeln.mpg.de/~lk/algo5a/algo5a.html Source: http://www.orgnet.com/sna
Social Network Visualization Foundational work of Jacob Moreno • The fewer number of lines crossing, the better the sociogram. • Variations in the shape points can communicate characteristics of social actors. • Variations in the locations of points can be used to stress important structural features of data Friendship choices made by fourth graders. Boys are shown with triangles and girls are circles. Boys are also drawn on the left and girls on the right. l Source: http://zeeb.library.cmu.edu:7850/JoSS/article.html
Social Network Visualization Foundational work of Northway Targeted Sociogram • Nested series of concentric circles • Each circle contains points that are equal in terms of frequency or distance from central node • Points in the central circles were chosen most often • Lines connecting them represent primary links between pairs • Points at the edge were chosen less often. • Points are placed in the rings in such a way that the lines connecting them are relatively short. Like Moreno's dictum about lines not crossing, Northway's rule that lines should be short has been widely adopted. l Source: http://zeeb.library.cmu.edu:7850/JoSS/article.html
Visualizing Email Egocentric Graph • Each rectangle represents one user. • User = red • Consultant = green • Researcher = blue • Partner = purple • None of the above = black • Each line is an email between two people. Thickness is number of emails. • This network is generated from all encrypted email traffic within the company http://www.ipresearch.net/email/chi/socialnetworkdetail.cgi?usr=demo
Visualizing Instant Messenger BuddyZoo on AOL Instant Messenger • Each rectangle represents one contact. • Lines are connections between contacts. • The graph is generated with your own AIM Screen Name at the center. • The color is assigned randomly. http://buddyzoo.com/
Visualizing YASNS 1 Dav Coleman’s Friendster: Global View • Network mapping of 5000 people. • Positions each friend on a map of the globe using their zip/postal code. Positions not available for outside of North America. • No way to see which friends are 1 degree, 2 degree or 3 degrees apart. • Can not see connections between people. http://danger-island.com/~dav/blogosphere/friendster/
Visualizing YASNS 2 GeOrkut • Positions each friend on a map of the North East using their zip code. • Clusters are number of people in each zip code. • No way to see which friends are 1 degree, 2 degree or 3 degrees apart. • Can not see connections between people. http://www.datawhorehouse.com/orkut/
Visualizing YASNS 3 Nick Galbraith’s Friendster Photo Graph • Egocentric graph. • People are grouped by their connections to each other. • Each line represents a one degree connection. http://www.wired.com/news/images/0,2334,59650-8088,00.html
Visualizing YASNS 4 Jeff Heer’s Friendster Network with force-directed layout • Nodes are the user names on Friendster • Each node pushes away from each other. Lines act as springs to bring them closer. • People who are connected pull together into groups. • Mouse-over shows one degree friends. http://prefuse.sourceforge.net/demos-force.html
Digital Artifacts for Remembering and Storytelling • typical e-mail user receives 12 e-mails at work each day (Gallop poll, 2001) • boyd et al. study on uncovering social patterns in email archives. • Visualizations to create “Social Landscapes” • Post History • Social Network Fragments Source: http://www.danah.org/papers/HICSS-37.pdf
Visualization: Post History • Calendar (left): • Size of square = quantity of email received • Brighter the square = more directed emails • Contacts (right): • Higher up = more messages sent to you • Colored name = email sent on that day Source: http://web.media.mit.edu/~fviegas/posthistory/vis.html
Digital Artifacts for Remembering and Storytelling • typical e-mail user receives 12 e-mails at work each day (Gallop poll, 2001) • boyd et al. study on uncovering social patterns in email archives. • Visualizations to create “Social Landscapes” • Post History: Observations on animation of interface Source: http://www.danah.org/papers/HICSS-37.pdf
Visualization: Social Network Fragments • Social Network (left): • Size of name = stronger tie • Color = Role: College, Family, Work • History (right): • Size of square = number of emails • Color = Role: College, Family, Work Source: http://smg.media.mit.edu/projects/SocialNetworkFragments/images