Download

1 / 6
60 likes | 189 Vues
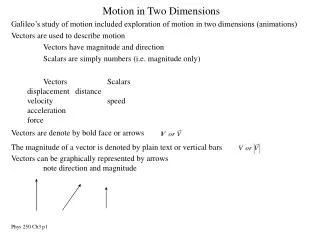
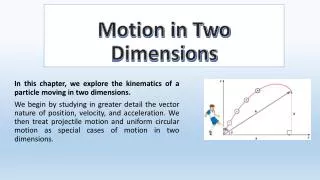
In this chapter, we explore two-dimensional motion, extending our knowledge from one dimension. Everyday movements, like a car turning or a baseball's flight, are analyzed using vectors, which have both magnitude and direction. We introduce the scale diagram approach to represent vectors visually, ensuring clarity in direction using a compass system for angles. Methods for adding vectors by connecting them tip-to-tail and the importance of a well-scaled diagram for accuracy are emphasized. Exercises and practice problems are included to reinforce learning.

E N D
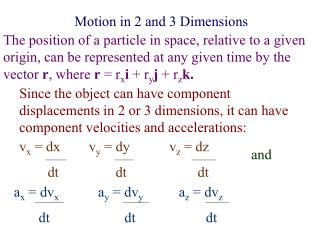
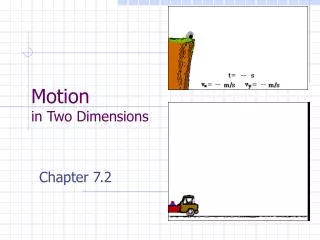
Motion in 2 Dimensions Most objects that we observe and experience everyday do not travel in straight lines. Their motions are best described as two-dimensional. A car turning on the road, or a baseball being hit in the air. In Chapter 1, we analyzed the motion an object in a straight. In Chapter 2, we will extend what we have learned about motion in one dimension to motion in two dimensions. Objects moving in two dimensions can be described using a horizontal plane or a vertical plane.
2.1 Scale Diagram Approach • We know vectors to be quantities that posses both magnitude and direction. • When focusing on the directional element of a vector, an arrow is used with the tail representing the start point of the vector, and the tip representing its end point.
2.1 Scale Diagram Approach • When adding two or more vectors together, be sure to connect the vectors ‘tip-to-tail’. • The vector that results from adding two or more vectors together is called the resultant vector. • When drawing a resultant vector, start at the tail of the first vector, and draw a straight line to the tip of the final vector.
2.1 Scale Diagram Approach • To specify the directional angle in which a vector is pointing, a compass system is utilized. • Primary compass directions include North, South, East, West. • Vectors which lie between primary directions, such as on the right, are read as follows: • [E 20° N] or its complementary [N 70° E]
2.1 Scale Diagram Approach • When drawing two-dimensional vectors using a scale diagram, a reasonable scale must be determined for the diagram considering the space you have to work with. • Generally speaking, the larger the diagram, the more accurate your results will be. • When drawing scale diagrams, a ruler is used to measure the correct magnitude, and a protractor is used to indicate the correct direction. • Scale diagram of 41 m [S 15° W] SP #1-3 p.62-64
2.1 Homework • Practice # 2 p.64 • Questions #1-4,7,8 p.65