Download
1 / 24
240 likes | 321 Vues
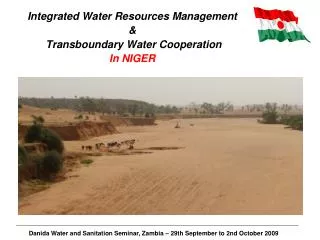
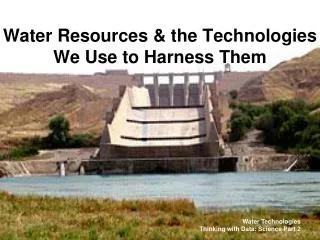
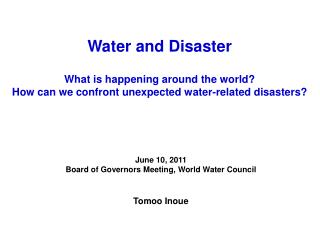
Can we classify the zones exposed to conflict risks around the transboundary water resources? Case of the Jordan basin. MENANI M.R., Earth Sciences Dept, Batna University, Algeria. Menani_redha@univ-batna.dz. Global Situation of Water in Africa and South America.

E N D
Can we classify the zones exposed to conflict risks around the transboundary water resources? Case of the Jordan basin. MENANI M.R., Earth Sciences Dept, Batna University, Algeria Menani_redha@univ-batna.dz
But how to integrate the presented elements within the framework of the law ? Some of them are not clear for me!!
National Law Steps of a Law International Law But it isn’t so easy as you think it Justice must intervene We have a serious problem about water
Risk of Conflict is defined by an INDEX Indicators of risk having weights proportional to their relative importance Combination Rates which traduce local conditions of these Indicators A partial index of risk (multiplication of weight by rate) The sum of these partial indices gives the global index of risk of conflict for a given region.
Risk Indicators and their respective weights • Degree of dependence to the transboundary water resources 5 • Satisfaction degree of the water needs 4 • Geopolitical context of the zone of conflict 3 • Geographical position in relation to the water resources 2 • Water governance by parties in conflict 2 The various factors, which in certain situations can be redundant, are evaluated separately and in an independent way because it is question of evaluating their intrinsic influences
Relative weights assigned to proposed indicators can lendto discussion however the following remarks guided this choice: 1 The highest weights Factors implying the water resource directly 2 3 Medium weight Factors implying the water resource implicitly 4 Weak weight The water governance is of local influence initially, but can act in a favourable and implicit way on the transboundary water resources. This factor is directly influenced by the development level of a country. 5 Weak weight
Rating intervals of the indicators of risk According to the local conditions the indicators of risk take values varying between 1 and 10 The highest dimensions indicate a high risk of tension and conversely Ratings must be established for each country concerned by the transboundary water resources (IPR = I iw. I ic) IPR: partial index of risk Iiw: indicator fixed weight Iic: indicator rate (variable) reached in the studied case
Ratings intervals of the dependence degree to the transboundary water resources Variation intervals Cotes Total dependence 10 Partial dependence with difficulties of satisfaction of the needs by other resources (natural and technical difficulties) 8 Partial with possibilities of supplying by other resources but with a high capital cost 6 Partial with possibilities of supplying by other resources with an advantageous capital cost 3 Partial to weak with an effective supply by other resources2 Partial index of minimum risk (PIR min) = fixed weight. Minimum rate = 5. 2 = 10 Partial index of maximum risk (PIR max) = fixed weight. Maximum Rate =5.10=50
The needs satisfaction degree Rating of the variation intervals of this indicator rests on the evaluation of the satisfaction degree of the needs of the concerned countries in the traditional categories of uses: Domestic consumption and the daily life logically most influential on the risk of conflict Agriculural needs infood It can in certain situations involve a fast reaction, for example in the case of the lack of water for a hydroelectric station, all the more if the problem is posed in a frontier context Industrial
The diversity of the situations same weight to these sub indicators : i.e. 4 The partial index for this indicator = ∑ Ip relating to the three uses / 3 However, in regions where industry is almost non-existent (poor countries), the weight of this factor is removed. The partial index is then obtained by dividing by 2 the indices relating to the two uses (agricultural and domestic). The standards of international institutions (WHO, FAO,UNO....) and the results of research works were taken into account in the development of the ratings intervals of the various uses.
Ratings intervals of the domestic use (l/p/d) < 50 10 50<x<100 8 100<x<200 6 200<x<300 5 300<x<400 4 400<x<500 2 x>500 1 Partial index of minimum risk (PIR min) = 4. 1 = 4 Partial index of maximum risk (PIR max) = 4. 10 = 40
Ratings intervals of the agricultural use are expressed as a percentage of surface to irrigate Ratings intervals of the satisfaction degree of the industrial needs are expressed in percentage of the needs Partial index relating to the 3 uses : Partial index of minimum risk (PIR min) = (3.4)/3 = 4 Partial index of maximum risk (PIR max) = (3.40)/3 = 40
Geopolitical context of the conflict zone Rating intervals Variation intervals Cotes Zone of war 10 Zone of diplomatic tension 8 Zone of ethnic tension 6 Normal relations between states 4 Zone related to a community space (ex European Community)1 Partial index of minimum risk (PIRmin) = 3 Partial Index of maximum risk (PIRmax) = 30
The geographic position of the belligerent countries For example, a country which is located in the upstream part of a river benefits better from this situation, either by its natural position or by a provoked way. Variation intervals Rate Existence of a provoked dominant position (Occupation by force, polluted water discharges, water derivations,...) 7 Existence of a natural dominant position 3 This concept is not exhaustive to rivers but also relates to groundwater and it integrates in an implicit way the environmental aspect. Partial index of minimum risk (PIR min) = 6 Partial index of maximum risk (PIR max) = 14
The water governance by parties in conflict The proposed rating intervals rest on factors which are inspired, among others, by the criteria of effective water governance proposed by the IWRMToolbox of the GWP (2001) Which gather tools at the same time for diagnosis and for assistance to an effective Governance which is based on cases studied throughout the world. For this indicator the mode of calculation suggested is to decrease the dimension attributed to each factor when this one exists
The weakest dimension for this indicator is obtained as follows: [10 – 9] = 1 Indeed, each time that one of the conditions of good governance is filled, the risk decreases obviously, until reaching the minimum dimension which is equal to 1, because the optimum governance in the field of water is never reached Partial index of minimum risk (PIR min) = 2 Partial index of maximum risk (PIR max) = 18
GIR : Global Index of Risk of Conflict around Transboundary Water Resources It is the sum of the partial indexes: • GIR = ∑ PIR = ∑ Iiw * Iic • According to this procedure, the global index of minimum risk of conflict is 25, whereas the maximum index is 158.
Example of the transboundary water resources of the Jordan river basin
2 difficulties: - One relating to the data concerning the satisfaction of the water needs, with confusions and differences between real, theoretical availability and real consumption. In this case, the approach must be very critical and thorough. -The other relating to the lacks of data concerning the state of the water governance in certain cases, which it was necessary to approach by estimation.
GIR min = 25 GIR max = 160 Ghaza Lebanon West Bank GIR Syria Jordan Israël For Israel, this index can evolve to 82 next years if the projects relating to Desalination of sea water are carried out. Those relate to a supplement varying between 500 and 750 million m3/y.
Conclusion • The combination between weights and rates lead to the numerical expression of the risk of conflict around the transboundary water resources. This weighted method applied in the same way to all concerned parties decreases the risk of error on the final result. • If the definition of certain ratings intervals can lend to discussion, the relative order of classification seems correct and the global index of risk of conflict around the transboundary water resources allows a classification of the zones relating to this risk and their cartography. First application on a concret case Correct estimation of the real situation
This approach allows : Standardized qualification of the risk of conflict around the transboundary water resources; Fast comparison between different regions of the world exposed at this risk; Cartographyof the zones at risk.
The databases of various organizations working in fields which are on relation with this context facilitate the acquisition of the majority of the data necessary for calculation of the various indices. These indices can be updated like the databases making it possible to follow the evolution of the global index of risk. • It is obvious that this approach can not be applied, at least with difficulty, to all situations because conditions are much diversified, but it allows an approach of the most common situations. Thank you