Natural Language Processing (NLP) + Visualization and Virtual Reality (VVR)
110 likes | 278 Vues
School of Computing FACULTY OF ENGINEERING . Natural Language Processing (NLP) + Visualization and Virtual Reality (VVR). An open discussion and exchange of ideas Introduced by Eric Atwell, Language Research Group. Saman Hina (NLP seminar coordinator): .

Natural Language Processing (NLP) + Visualization and Virtual Reality (VVR)
E N D
Presentation Transcript
School of Computing FACULTY OF ENGINEERING Natural Language Processing (NLP) + Visualization and Virtual Reality (VVR) An open discussion and exchange of ideas Introduced by Eric Atwell, Language Research Group
Saman Hina (NLP seminar coordinator): • “… Eric will present aspects of NLP research projects which involve "visualisation" of text, to seek advice on further visualisation techniques NLP researchers should consider; and other NLPers can ask about visualisation techniques they could use. The VVR "angle" may be that current visualisation methods work mainly for numerical datasets, so the VVR people might benefit from ideas on text analytics techniques which might "turn text into numbers“: what sorts of number-vectors can represent meanings of texts, and how to extract them.”
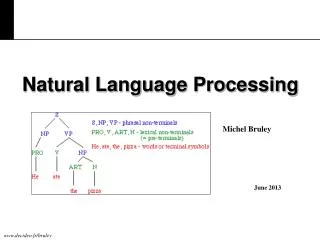
Typical NLP research • NLP research often involves developing an algorithm to automatically process some text and output “analysis”, eg • For each word, its Part of Speech (or semantic class, or…) • For each sentence, its grammatical structure (parse-tree) • For each text, its classification: Genre, sentiment, CoD, “interesting” wrt specific task/users • Often this is done by Machine Learning: given a training dataset of example words/sentences/texts, each marked (beforehand) with its Class … learn a Classifier which can predict the Class of any new, unseen word/sentence/text. • The algorithm is automatic, so where does Visualisation fit?
Visualisation of feature space? • Machine Learning is automatic (eg using WEKA toolkit), the classification is not done by humans … • BUT ML relies on mapping each word/sentence/text into a set of FEATURES which characterise the data • Visualisation may guide the researcher in exploring the dataset, to choose “useful” features? • OR: ML with different parameter-settings can produce different classification models; Visualisation may help the researcher to compare the models?
Typical NLP dataset: a CORPUS (plural: Corpora or Corpuses) • Quran – English translation; “interesting” subset of verses • Leeds Arabic NLP http://www.comp.leeds.ac.uk/arabic/ • Arabic morphological analysis tools • Quranic Arabic Corpus http://corpus.quran.com/ • Verbal Autopsy interviews: narrative text + yes/no, numbers • SNOMED-CT Systematized Nomenclature of Medicine Clinical Terms adopted by UK NHS and US health authorities
Verbal Autopsy Dataset • Verbal Autopsy: interview of mother after death of her baby. • Data collected as part of a main trial over 7 year period • 10,000 interview reports; Data collected includes: • Signs and symptoms that led to the death • History of any ailments • Socio economic characteristic • Care seeking and treatment • Fertility and obstetric history • Classification of Cause of Death by doctors at LSHTM - London School of Hygene and Tropical Medicine, Uni London • Based on signs, symptoms and expert knowledge
Problems with VA data • Both quantitative and qualitative • Missing values (-) • 215 variables (plus narrative text) • Entries can have opaque codes • sex = 1, 2, 8 or 9 • Weight= 1.45, 9.99 or 8.88 • Continuous revision of questionnaire created blank values for some variables • Visualization of decision tree is problematic (size =1043, leaves=601); also other classifier outputs, eg Naïve Bayes
Visualising Corpus Linguistics • Paul Rayson presented overview of techniques at CL’2009 International Conference on Corpus Linguistics: • Paul Rayson and John Mariani, 2009. • Visualising Corpus Linguistics • I like the Key Word Clouds from CL2001 … CL2009 !!! • … Wordle etc make pretty pictures, for PR etc; • BUT do “word clouds” actually help guide NLP research???
Open to discussion • Over to you: • NLPers can ask about visualisation techniques they could use • VVRers can ask about ideas on text analytics techniques which might “turn text into numbers” • And/or any other ideas? … • THANK YOU for your participation