Stars
310 likes | 331 Vues
Discover the secrets of stars - from formation to fusion and luminosity. Learn about the impact of mass, pressure, and temperature on a star's brilliance and energy output.

Stars
E N D
Presentation Transcript
Stars • Stars are the things you see most of in the night sky. • You already know all about the Sun, which is a pretty good example of an average star • But what exactly is a star???
Stars • Stars are formed by interstellar dust coming together through mutual gravitational attraction. • The loss of potential energy is responsible for the initial high temperature necessary for fusion. • The fusion process releases so much energy that the pressure created prevents the star from collapsing due to gravitational pressure.
Nuclear fusion Very high temperatures are needed in order to begin the fusion process: usually 107 K.
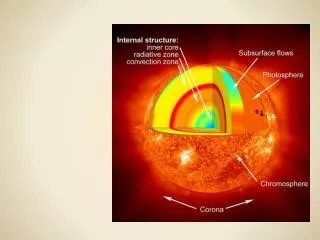
A star is a big ball of gas, with fusion going on at its center, held together by gravity! Massive Star Sun-like Star Low-mass Star There are variations between stars, but by and large they’re really pretty simple things.
What is the most important thing about a star? MASS! The mass of a normal star almost completely determines itsLUMINOSITY and TEMPERATURE! • Note: “normal” star means a star that’s fusing Hydrogen into Helium in its center (we say “hydrogen burning”).
The LUMINOSITY of a star is how much ENERGY it gives offper second: This light bulb has a luminosity of 60 Watts The energy the Sun emits is generated by the fusion in its core…
What does luminosity have to do with mass? The mass of a star determines the pressure in its core: Pressure Gravity pulls outer layers in, Gas Pressure pushes them out. The core supports the weight of the whole star! The more mass the star has, the higher the central pressure!
The core pressure determines the rate of fusion… PRESSURE & TEMPERATURE RATE OF FUSION MASS …which in turn determines the star’s luminosity!
Luminosity is an intrinsic property… it doesn’t depend on distance! This light bulb has a luminosity of 60 Watts… …no matter where it is, or where we view it from, it will always be a 60 Watt light bulb.
Luminosity The Luminosity of a star is the energy that it releases per second. Sun has a luminosity of 3.90x1026 W (often written as L): it emits 3.90x1026 joules per second in all directions. The energy that arrives at the Earth is only a very small amount when compared will the total energy released by the Sun.
Apparent brightness • When the light from the Sun reaches the Earth it will be spread out over a sphere of radius d. The energy received per unit time per unit area is b, where: d b is called the apparent brightness of the star
Luminosity Exercise 13.1 The Sun is a distance d=1.5 x 10¹¹ m from the Earth. Estimate how much energy falls on a surface of 1m2 in a year. L= 3.90x1026 W d
d At a distance of d=1.5 x 10¹¹ m, the energy is “distributed” along the surface of a sphere of radius 1.5 x 10¹¹ m The sphere’s surface area is given by: A = 4πd2 = 4 π x (1.5 x 1011)2 = =2.83 x 10²³ m2 The energy that falls on a surface area of 1m2 on Earth per second will be equal to: b =L/A = 3.90x1026 / 2.83 x 1023 = = 1378.1 W/m2 or 1378.1 J/s m2 In a year there are: 365.25days x 24h/day x 60min/h x 60s/min = 3.16 x 10⁷ s So, the energy that falls in 1 m2 in 1 year will be: 1378.1 x 3.16 x 107 = 4.35 x 10¹⁰ joules
Black body radiation • A black body is a perfect emitter. A good model for a black body is a filament light bulb: the light bulb emits in a very large region of the electromagnetic spectrum. • There is a clear relationship between the temperature of an object and the wavelength for which the emission is maximum. That relationship is known as Wien’s law:
Wien Displacement law • By analysing a star’s spectrum, we can know in what wavelength the star emits more energy. • The Sun emits more energy at λ=500 nm. • According to Wien’s law, the temperature at the Sun’s surface is inversely proportional to the maximum wavelength. • So:
Black body radiation • Apart from temperature, a radiation spectrum can also give information about luminosity. • The area under a black body radiation curve is equal to the total energy emitted per second per unit of area of the black body. Stefan showed that this area was proportional to the fourth power of the absolute temperature of the body. • The total power emitted by a black body is its luminosity. • According to the Stefan-Boltzmann law, a body of surface area A and absolute temperature T has a luminosity given by: where, σ = 5.67x10⁸ W m-2 K-4
Why is this important? • The spectrum of stars is similar to the spectrum emitted by a black body. • We can therefore use Wien Law to find the temperature of a star from its spectrum. • If we know its temperature and its luminosity then its radius can be found from Stephan-Boltzmann law.
Blackbody Spectrum Emission and Absorption Lines Real spectra are more complicated than this (remember emission and absorption lines?)
Stars can be arranged into categories based on the features in their spectra… This is called “Spectral Classification” How do we categorize stars? A few options: by the “strength” (depth) of the absorption lines in their spectra by their color as determined by their blackbody curve by their temperature and luminosity
First attempts to classify stars used the strength of their absorption lines… Stars were labeled “A, B, C…” in order of increasing strength of Hydrogen lines. They also used the strength of the Harvard “computers”! Williamina Fleming
Later, these categories were reordered according to temperature/color… OBAFGKM(LT)! Annie Jump Cannon
OBAFGKM - Mnemonics OBeAFineGirl/GuyKissMe Osama Bin Airlines! Flies Great, Knows Manhattan! Only Boring Astronomers Find Gratification in Knowing Mnemonics!
Eventually, the connection was made between the observables and the theory. Observable: • Strength of Hydrogen Absorption Lines • Blackbody Curve (Color) Theoretical: • Using observables to determine things we can’t measure: Temperature and Luminosity Cecilia Payne
“If a picture is worth a 1000 words, a spectrum is worth 1000 pictures.” • Spectra tell us about the physics of the star and how those physics affect the atoms in it
The Hertzsprung-Russell diagram This diagram shows a correlation between the luminosity of a star and its temperature. The scale on the axes is not linear as the temperature varies from 3000 to 25000 K whereas the luminosity varies from 10-4 to 106, 10 orders of magnitude. You are here
H-R diagram • The stars are not randomly distributed on the diagram. • There are 3 features that emerge from the H-R diagram: • Most stars fall on a strip extending diagonally across the diagram from top left to bottom right. This is called the MAIN SEQUENCE. • Some large stars, reddish in colour occupy the top right – these are red giants (large, cool stars). • The bottom left is a region of small stars known as white dwarfs (small and hot)