Download
1 / 44
440 likes | 443 Vues
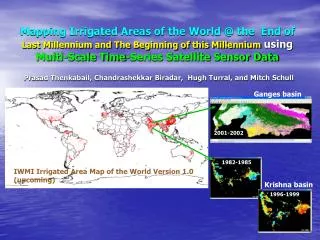
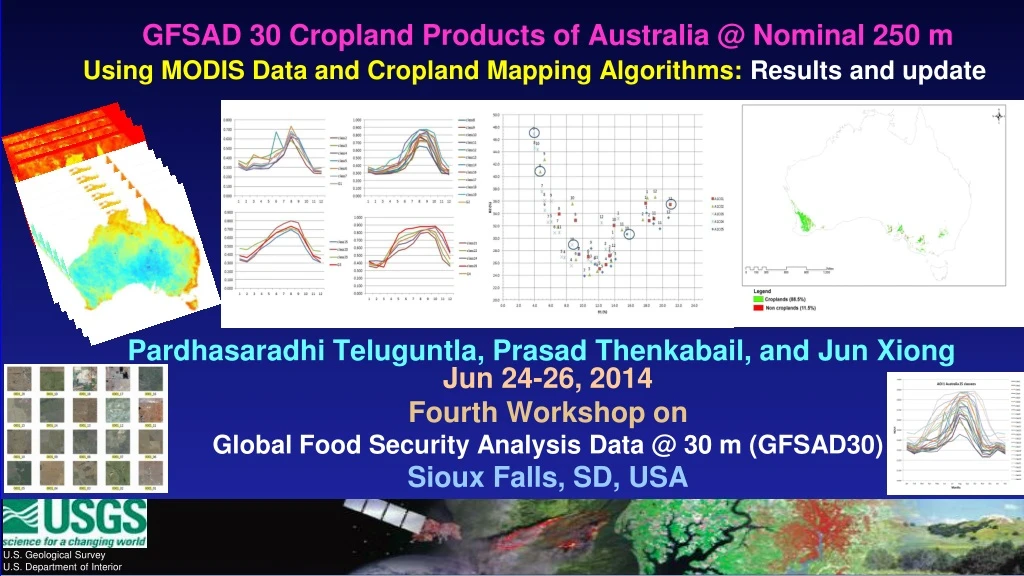
This presentation discusses the goals, methods, and preliminary results of the GFSAD30 Cropland Products of Australia project, which aims to produce 5 products related to cropland extent, cropping intensity, watering method, crop type, and land cover change. The presentation also highlights the limitations of existing global cropland products and introduces the approach of the Cropland Mapping Algorithms (CMAs) for automated cropland classification.

E N D
GFSAD 30 Cropland Products of Australia @ Nominal 250 mUsing MODIS Data and Cropland Mapping Algorithms: Results and update PardhasaradhiTeluguntla, Prasad Thenkabail, and Jun Xiong Jun 24-26, 2014 Fourth Workshop on Global Food Security Analysis Data @ 30 m (GFSAD30) Sioux Falls, SD, USA
GFSAD30 Cropland Products of Australia @ nominal 250 mOutline • Goals and Objectives • Issues • Data: BDI for Australia • Methods and Preliminary results • Classification, identification, and label classes for the 4 products • Automated Algorithms\script to automatically compute the 4 products • Discussion
GFSAD30 Products for Australia Goals and Objectives
GFSAD30 Cropland Products of Africa @ Nominal 250 m Goal: to Produce 5 Products of GFSAD30 Project • Cropland Extent • Croplands vs. non-croplands • Cropping Intensity • Single, double, triple, continuous cropping • Watering Method • Irrigated vs. rainfed • Crop Type • Major 8 crops and others • Cropland change over space and time • Major 8 crops and others We will focus on these 3 products for now in this presentation These products are not part of this presentation
GFSAD30 Cropland Products of Australia @ Nominal 250 m Current State-of-Art on Global Croplands: 12 Classes derived from 4 existing products GCE V1.0 • State-of-Art • There are 3 global cropland products + several land cover land use products in which croplands is a class • Limitations • coarse resolution (1 km or higher) • Lack of detailed work on croplands (e.g., where are the irrigated areas, what is the frequency of cropping, what crops are grown and where?, what changes are occuring) The 12 classes constitute 12 AOIs. Class 1 = AOI 1, Class 2 = AOI 2….. Class 12 = AOI 12
Cropland Mapping Algorithms (CMAs) Approach to Producing GFSAD30 Products
Cropland Mapping Algorithms (CMAs) Approach to Automated Cropland Classification Algorithms We will approach development of GFSAD30 products in two distinct steps: • Synergestic approaches to cropland classification leading to • Class identification and labeling; • Creation of knowledge base • Automated cropland classification algorithms • Development and implementation of Automated algorithm to reproduce cropland products year after year We will discuss this today We will not discuss this today
Cropland Mapping Algorithms (CMAs) Datasets and MegafileDatacubes
Cropland Mapping Algorithms (CMAs) for Australia Datasets in the Megafile for entire Australia: nominal Year 2000 • MODIS Data Composition: 36 layers per year • monthly NDVI maximum value composite (MVC): 12 layers per year; • monthly B1 Minima: 12 layers per year; • monthly B2 Maxima: 12 layers per year; • Secondary data • Elevation, slope, Precipitation, surface temperature, PET etc
GFSAD30 Cropland Products of Australia @ nominal 250 mFirst Start with GCE V1.0 (~ 1 km): 12 Classes Note: We will take each GCE V1.0 class and investigate how much of that is croplands versus non croplands @ 250 m MODIS resolution; In addition, we will establish cropping intensity and irrigated vs. rainfed This leads to GCE V2.0 @ 250 m
Cropland Mapping Algorithms (CMAs) for Australia Process for producing GCE V2.0 @ 250 m resolution using MODIS data for nominal year 2000 MODIS 250 m Mega file data cube (36 Layers ): 12 B1 minima, 12 B2 maxima, 12 NDVI (one band per month) Final Output GCE V2.0 (illustrated here for AOI 1 which has 5 classes) AOI / segments GCE V1.0 Calssify
Cropland Mapping Algorithms (CMAs) Synergestic Cropland Classification and Identification (SCCI)
Cropland Mapping Algorithms (CMAs) for Africa Synergestic Cropland Classification and Class Identification (SCCI) Synergestic Cropland Classification and Class Identification (SCCI) involves: • Classification • unsupervised ISOCLASS clustering of MFDC; • Class Grouping and identification • Spectral matching technique: SCS R-square grouping; • bispectral tassel cap plots for better understanding of classes; • NDVI phenological plots to determine cropping intensity and class identification C. Class labeling • Very high resolution imagery from ESRI archive • Ground data
Australia: AOI-1 Unsupervised ISOCLASS classification using MODIS 250m MFDC: 25 classes
Australia: AOI-1 Tassel cap/ Bi-Spectral plots: 25 classes Example1 : Class 1 (cropland) showing how band 1 (red) and band 2 (NIR) reflectivity varies from month to month
Australia: AOI-1 Tassel cap/ Bi-Spectral plots: 25 classes Example1 : Class 1 (non-cropland) showing how band 1 (red) and band 2 (NIR) reflectivity varies from month to month
Australia: AOI-1 NDVI time series:25 classes; Class 1 identification process detailed Sub-meter to 5 meter imagery Non cropland Non cropland
Australia: AOI-1 NDVI time series:25 classes; Class 12 identification process detailed Croplands; identified from VHRI (sub-meter to 5 meter imagery) Croplands; identified from VHRI (sub-meter to 5 meter imagery)
Synergestic Cropland Classification and Identification (SCCI) re-grouping of classes of AOI 1 for Australia
Spectral Matching Technique: SCS R-square to Group ClassesSCS- R2 Matrices for AOI1; Australia
Australia: AOI-1 re-grouping 25 classes to unique croplands versus non-cropland classes using SCS- R2 6 Highly correlated classes
Australia: AOI-1 re-grouping 25 classes to unique croplands versus non-cropland classes using SCS- R2 12 highly correlated classes
Australia: AOI-1 re-grouping 25 classes to unique croplands versus non-cropland classes using SCS- R2
Australia: AOI-1 re-grouping 25 classes to unique croplands versus non-cropland classes using SCS- R2
Australia: AOI-1 re-grouping 25 classes to unique croplands versus non-cropland classes using SCS- R2 Finally, 25 classes are grouped into 4 unique classes
Australia: AOI-1 Tassel cap Bi-Spectral plot characteristics of the Final 5 re-grouped classes • How to separate / distinguish Classes • Example : • Class 1 month 12 • Class 2 month 8 • Class 3 month 10 • Class 4 month 9 • Class 5 month 10 Note: We can distinctly distingwish the 5 classes in these particular months
GFSAD30: Australia Class Naming Convention • Stage 1 Croplands vs. Non-croplands • Stage 2 single, double, triple, or continuous cropping • Stage 3 irrigation versus rainfed • Stage 4 8 major crops or others
We will use the following data to label this: VHRI (sub meter to 5 meter; Ground data GCE V1.0 Class Naming Convention We will use the following data to label this: NDVI phenology; Bispectral plots SCS R-square dendogram VHRI (sub-meter to 5 meter) Ground data We will use the following data to label this: NDVI phenology plots; Croplands, single, irrigated Non-croplands Note: 1.14 million hectares of AOI 1 (out of 9,89 M ha) is non croplands in GCE V2.0. This was classified as croplands in GCE V1.0
Australia: AOI-1 Class Identification and Labeling Process: Distribution of Random areas for Each Class for selecting VHRI For each of the 5 classes 20 random areas are chosen for selecting VHRI (sub meter to 5 m)….. A total of 100 VHRI are selected for the 5 classes of AOI 1
Australia: AOI-1 20 very high resolution images (VHRI; sub-meter to 5 meter) for class 1 of AOI 1
Australia: AOI-1 20 very high resolution images (VHRI; sub-meter to 5 meter) for class 2 of AOI 1
Australia: AOI-1 20 very high resolution images (VHRI; sub-meter to 5 meter) for class 3 of AOI 1
Australia: AOI-1 20 very high resolution images (VHRI; sub-meter to 5 meter) for class 4 of AOI 1
Australia: AOI-1 20 very high resolution images (VHRI; sub-meter to 5 meter) for class 5 of AOI 1
GFSAD30: Australia Class Naming Convention for AOI 1, 5 final classes of Australia
GFSAD30: Australia Class Naming Convention for AOI 1, 5 final classes of Australia MODIS 250 m GCE V2.0 for AOI 1 Note: Omissions: 11.5% (class 4 and 5) of the AOI 1 area of GCE V1.0 @ nominal 1 km is now non-croplands in GCE V2.0 @ 250 m
GFSAD30: Australia Class Naming Convention for AOI 1, 5 final classes of Australia and their Characteristics
GFSAD30: Australia Final classes of AOI 1 in GCE V1.0 (1 km) vs. GCE V2.0 (250 m) AOI-1 of Australia @ 250m resolution Cropland area = 8.75 M ha 11.5% of area is omission AOI-1 of Australia @1km resolution Cropland area = 9.89 M ha (full pixel area )
Cropland Mapping Algorithms (CMAs) Approach to Automated Cropland Classification Algorithms • Automated cropland classification algorithms • Development and implementation of Automated algorithm to reproduce cropland products year after year ………the above work is in progress
Australia: AOI-1 :GCE V1.0 vs GCEV 2.0 AOI-1 of Australia @1km resolution Cropland area = 9.89 M ha (full pixel area ) AOI-1 of Australia @ 250m resolution Cropland area = 8.75 M ha 11.5% of area is omission
Australia: AOI-1 Tassel cap/ Bi-Spectral plots: integrated picture of 25 classes