Download
1 / 31
320 likes | 518 Vues
Unit 11: Atmospheric Moisture and the Water Balance. Properties of Water Water Vapor & its M easurements The H ydrological Cycle Evaporation Condensation, Clouds Precipitation Processes Surface W ater Balance. The hydrological cycle in action. . OBJECTIVES

E N D
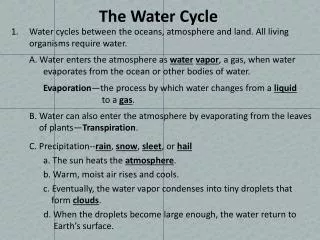
Unit 11: Atmospheric Moisture and the Water Balance Properties of Water Water Vapor & its Measurements The Hydrological Cycle Evaporation Condensation, Clouds Precipitation Processes Surface Water Balance The hydrological cycle in action.
OBJECTIVES • • Discuss the various forms of water and understand the important heat transfers that accompany changes of these physical states • Explain the various measures of atmospheric humidity, how they are related, and the processes responsible for condensation • • Outline the hydrologic cycle and the relative amounts of water that flow within this cycle. • Understand the process of evaporation. • Examine the conditions necessary for the formation of clouds. • • Introduce the concept of precipitation • • Describe the Earth’s surface water balance and its variations
Phase Changes of Water, Latent Heat Heat is consumed in evaporation, melting; heat is released in condensation, freezing (sublimation). Schematic view of the molecular structure of water in its three physical states and heat-energy exchange among those states. The latent heat-exchange numbers between the arrows are explained in the text (values are for 0°C).
Measurements of water vapor Vapor pressure is the pressure exerted by water vapor molecules Saturated vapor pressure is maximum pressure of water vapor at that temperature Dew point is the temperature the air must be cooled to reach saturation Relative humidity is ratio of water vapor in air to maximum the air can hold at that temperature. RH is usually highest when daily temp- erature is lowest. Specific humidity is the mass of water Vapor in the air per unit mass of air. Mixing ratio is the mass of water vapor in The air to the mass of dry air containing the Water vapor. Variation of saturation vapor pressure (mb) with temperature (C). The curve is nearly a pure exponential. At temperatures below 0C saturation values over supercooled water are greater than over ice.
Relative Humidity Figure 5.7
Humidity Patterns Figure 5.10
Maximum Specific Humidity Figure 5.12
Evaporation, Evapotranspiration • The rate of evaporation depends on: temperature, humidity, wind speed and water quality (salinity) • Plants lose water to the atmosphere through transpiration • Evapotranspiration is the loss of water from the soils and plants to the air • Potential evapotranspiration (PE) is the maximum evapotranspiration lost when abundant water is available • Actual evapotranspiration (AE) is the amount of water lost in any actual amount of soil moisture • AE is usually less than PE, except when there is abundant water available, like a swamp or water surface. In deserts, PE might be very high, while AE is very low.
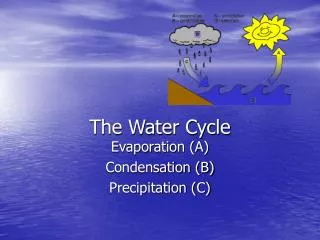
Fig 12.2 Hydrologic cycle. The numbers attached to the stages express each value as the volume of water divided by Earth surface area. Thus the values shown represent the depth of water (centimeters per year) associated with each mass transfer. All can be directly compared to the global average precipitation rate, which is about 100 cm/year.
Water in the Hydrosphere • Most of the water is salt water in the ocean • Most of the fresh water is locked up in ice sheets and glaciers • Most of the liquid fresh water is in the ground Fig 12.3 Distribution of water in the hydrosphere. The middle and lower bars show the percentage distribution of the 2.8 percent of total hydrospheric water that is fresh. Of that freshwater component, only about one-tenth is easily available to humans.
Water Usage in the United States, 2005 Which states use the most water? Total water withdrawals (millions gallons per day) for the United States in 2005.
Condensation and Clouds • For water vapor to condense into liquid, there must be • -condensation nuclei for water molecules to condense upon • -sufficient water vapor to reach saturation by either cooling or through evaporation of more water vapor • Condensation at the ground is dew or frost (if temperature is below freezing) • Condensation near the ground can form fog, if the cloud is in contact with the surface • Condensation above the ground can form clouds
Condensation near the ground forms fog, a cloud in contact with the ground. As the ground and surface air cools to the dewpoint, water vapor condenses into a radiation fog (cooling by longwave radiation overnight) here in East Africa.
Advection Fog Figure 5.20
Evaporation Fog Figure 5.21
Valley Fog Figure 5.25 Figure 5.22
Radiation Fog Figure 5.23
Cloud Types Schematic diagram of the different cloud types – stratus, cumulus, and cirrus, arranged by their typical altitude.
Precipitation Processes The Ice-Crystal Process-requires the coexistence of ice and super-cooled water droplets in the cloud. Ice grows at the expense of water droplets that evaporate water molecules which adhere to the ice until they are large enough to fall as snow. If the air is warm enough, the snow melts and rain occurs. The Coalescence Process-requires different sizes of water droplets within warm clouds. Larger droplets grow by falling faster and sweeping up smaller droplets by coalescing until they are large enough to fall as rain. Source: http://collider.com/singin-in-the-rain-60th-anniversary-blu-ray-review/191992/
Types of Precipitation • Besides rain and snow, there is: • Sleet-melting ice that refreezes before reaching ground • Freezing rain-melting ice that freezes on contact with a frozen surface • Hail-ice particles that grow within • clouds that have strong updrafts • Graupel-soft, partially melted hail Source: http://climate.met.psu.edu/features/Hail/PEMA_hail.php Four major forms of precipitation. (A) A rainstorm douses the Ponderosa Pine Forest near Flagstaff, Arizona. (B) Falling snow accumulates in south-central Alaska. (C) Freezing rain forms an icy coating on pine needles on a golf course in Wawona, near Yosemite National Park, California. (D) Golf-ball-sized hailstones litter the countryside following a storm in northern Texas.
Four Forms of Precipitation B A A-rainstorm B-snow C-freezing rain D-hail C D
The Water Balance • Based on methods devised by climatologist C. Warren Thornthwaite, calculates inputs and outputs of water at the Earth’s surface based on simple formulae using monthly temperatures and precipitation of a station. • When PE is greater than P (precipitation), there is water loss • When P is greater than PE, there is a water gain • By calculating monthly PE values and comparing with P, one can calculate amounts of surplus (runoff) and deficit (not enough soil moisture) in surface water. • Different climates exhibit different water balances
Water Balance for Different Climates Range of water balance conditions found at the surface of Earth. (A) Baghdad, Iraq, experiences a constant deficit because potential evapotranspiration normally exceeds precipitation. (B) At Tokyo, Japan, the situation is reversed, and a constant water surplus is recorded. (C) At Faro, Portugal, the intermediate situation occurs, with a combination of surplus and deficit at different times of the year.
Water Balance Averages by Latitude Average annual latitudinal distribution of precipitation, evapotranspiration, and runoff in cm per year. The arrows show the direction of the water vapor flux by the atmospheric circulation.
Global Distribution of Annual Evaporation, Evapotranspiration Fig 12.10? Global distribution of annual evaporation and evapotranspiration in centimeters, with land elevations adjusted to sea level. Red isolines show the pattern over land; blue isolines over the oceans.
Global Distribution of Annual Precipitation Source: http://www-das.uwyo.edu/~geerts/cwx/notes/chap10/global_precip.html Global distribution of annual precipitation in millimeters/day.