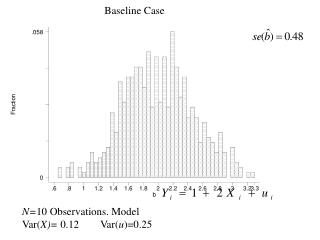
Analyzing Linear Parsimony with Maximum Likelihood and Branch Lengths
This study employs a linear parsimony approach combined with Maximum Likelihood (ML) and branch lengths (BL) to analyze phylogenetic data. We reference methodologies from Oakley and Cunningham (2000) and Polly (2001), highlighting key findings using independent contrasts. The analysis evaluates time variability and includes statistical correlations (R values) to support conclusions drawn from the datasets. The results contribute to understanding evolutionary patterns through rigorous statistical frameworks.

Analyzing Linear Parsimony with Maximum Likelihood and Branch Lengths
E N D
Presentation Transcript
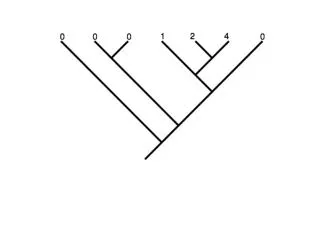
0 2 1 0 0 0
Squared change parsimony = ML with BL = 1 Linear parsimony 2.44 0.08 0 2 1.32 1 0.52 0 0.24 0 0.12 0 ML with BL as shown 0.096 2.54 1.6 0.96 0.67 0.56
time var(x)
ML with BL as shown C F E D B A
2 8 6 16 1 6 11 14 8.5 9 11.5 11 19 18 13 12 a b R = 0.74
2 8 6 16 1 6 11 14 8.5 9 11.5 11 19 18 13 12 a 10 8 4 8 3 2 -6 -6 4 12 6 10 10 10 16 15 2 -2 6 5 5 11 13 17 8 6 9 14 b c R = 0.74 R = 0.92
A21223 Fig. 2