Download
1 / 196
2k likes | 2.24k Vues
Review of Macroeconomics. THE ROOTS OF MACROECONOMICS. THE GREAT DEPRESSION. Great Depression The period of severe economic contraction and high unemployment that began in 1929 and continued throughout the 1930s. THE ROOTS OF MACROECONOMICS. Classical Models.

E N D
THE ROOTS OF MACROECONOMICS THE GREAT DEPRESSION Great Depression The period of severe economic contraction and high unemployment that began in 1929 and continued throughout the 1930s.
THE ROOTS OF MACROECONOMICS Classical Models Classical economists applied microeconomic models, or “market clearing” models, to economy-wide problems. Simple classical models failed to explain the prolonged existence of high unemployment during the Great Depression. This provided the impetus for the development of macroeconomics.
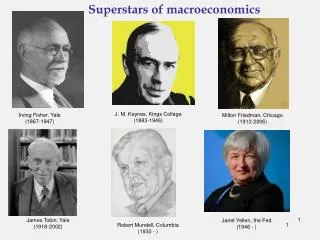
THE ROOTS OF MACROECONOMICS The Keynesian Revolution In 1936, John Maynard Keynes published The General Theory of Employment, Interest, and Money. Much of macroeconomics has roots in Keynes’s work. According to Keynes, it is not prices and wages that determine the level of employment, as classical models had suggested, but instead the level of aggregate demand for goods and services.
MACROECONOMIC CONCERNS Three of the major concerns of macroeconomics are: ■ Inflation ■ Output growth ■ Unemployment
MACROECONOMIC CONCERNS INFLATION AND DEFLATION inflation An increase in the overall price level. hyperinflation A period of very rapid increases in the overall price level. deflation A decrease in the overall price level.
MACROECONOMIC CONCERNS OUTPUT GROWTH: SHORT RUN AND LONG RUN business cycle The cycle of short-term ups and downs in the economy. aggregate output The total quantity of goods and services produced in an economy in a given period.
MACROECONOMIC CONCERNS recession A period during which aggregate output declines. Conventionally, a period in which aggregate output declines for two consecutive quarters. depression A prolonged and deep recession.
MACROECONOMIC CONCERNS UNEMPLOYMENT unemployment rate The percentage of the labor force that is unemployed.
GOVERNMENT IN THE MACROECONOMY There are three kinds of policy that the government has used to influence the macroeconomy: 1. Fiscal policy 2. Monetary policy 3. Growth or supply-side policies
GOVERNMENT IN THE MACROECONOMY FISCAL POLICY fiscal policy Government policies concerning taxes and expenditures (spending).
GOVERNMENT IN THE MACROECONOMY MONETARY POLICY monetary policy The tools used by the Federal Reserve to control the quantity of money in the economy.
GOVERNMENT IN THE MACROECONOMY GROWTH POLICIES supply-side policies Government policies that focus on stimulating aggregate supply instead of aggregate demand.
THE COMPONENTS OF THE MACROECONOMY • Macroeconomics focuses on four groups: • households and • firms, which together compose the private sector, • the government (the public sector), and • the rest of the world (the international sector).
THE U.S. ECONOMY SINCE 1900:TRENDS AND CYCLES EXPANSION AND CONTRACTION: THE BUSINESS CYCLE FIGURE 5.3 A Typical Business Cycle
THE U.S. ECONOMY SINCE 1900:TRENDS AND CYCLES expansion or boom The period in the business cycle from a trough up to a peak, during which output and employment rise. contraction, recession, or slump The period in the business cycle from a peak down to a trough, during which output and employment fall.
THE U.S. ECONOMY SINCE 1900:TRENDS AND CYCLES FIGURE 5.4 Real GDP, 1900–2004
THE U.S. ECONOMY SINCE 1900:TRENDS AND CYCLES THE U.S. ECONOMY SINCE 1970 FIGURE 5.5 Real GDP, 1970 I–2005 II
THE U.S. ECONOMY SINCE 1900:TRENDS AND CYCLES FIGURE 5.6 Unemployment Rate, 1970 I–2005 II
GROSS DOMESTIC PRODUCT gross domestic product (GDP) The total market value of all final goods and services produced within a given period by factors of production located within a country. GDP is the total market value of a country’s output. It is the market value of all final goods and services produced within a given period of time by factors of production located within a country.
GROSS DOMESTIC PRODUCT FINAL GOODS AND SERVICES final goods and services Goods and services produced for final use. intermediate goods Goods that are produced by one firm for use in further processing by another firm. value added The difference between the value of goods as they leave a stage of production and the cost of the goods as they entered that stage.
GROSS DOMESTIC PRODUCT In calculating GDP, we can either sum up the value added at each stage of production or we can take the value of final sales. We do not use the value of total sales in an economy to measure how much output has been produced.
GROSS DOMESTIC PRODUCT EXCLUSION OF USED GOODS AND PAPER TRANSACTIONS GDP is concerned only with new, or current, production. GDP ignores all transactions in which money or goods change hands but in which no new goods and services are produced.
CALCULATING GDP THE EXPENDITURE APPROACH There are four main categories of expenditure: Expenditure Categories: ■ Personal consumption expenditures (C): household spending on consumer goods ■ Gross private domestic investment (I): spending by firms and households on new capital, i.e., plant, equipment, inventory, and new residential structures ■ Government consumption and gross investment (G) ■ Net exports (EX - IM): net spending by the rest of the world, or exports (EX) minus imports (IM) GDP = C + I + G +(EX - IM)
CALCULATING GDP Personal Consumption Expenditures (C) personal consumption expenditures (C) A major component of GDP: expenditures by consumers on goods and services. There are three main categories of consumer expenditures: durable goods, nondurable goods, and services.
CALCULATING GDP durable goods Goods that last a relatively long time, such as cars and household appliances. nondurable goods Goods that are used up fairly quickly, such as food and clothing. services The things we buy that do not involve the production of physical things, such as legal and medical services and education.
CALCULATING GDP Gross Private Domestic Investment (I) gross private domestic investment (I) Total investment in capital—that is, the purchase of new housing, plants, equipment, and inventory by the private (or nongovernment) sector. nonresidential investment Expenditures by firms for machines, tools, plants, and so on.
CALCULATING GDP residential investment Expenditures by households and firms on new houses and apartment buildings. Change in Business Inventories change in business inventories The amount by which firms’ inventories change during a period. Inventories are the goods that firms produce now but intend to sell later. GDP = final sales + change in business inventories
CALCULATING GDP Gross Investment versus Net Investment depreciation The amount by which an asset’s value falls in a given period. gross investment The total value of all newly produced capital goods (plant, equipment, housing, and inventory) produced in a given period. net investment Gross investment minus depreciation. capitalendof period = capitalbeginningof period + net investment
CALCULATING GDP Government Consumption and Gross Investment (G) government consumption and gross investment (G) Expenditures by federal, state, and local governments for final goods and services.
CALCULATING GDP Net Exports (EX - IM) net exports (EX - IM) The difference between exports (sales to foreigners of U.S.- produced goods and services) and imports (U.S. purchases of goods and services from abroad). The figure can be positive or negative.
NOMINAL VERSUS REAL GDP current dollars The current prices that one pays for goods and services. nominal GDP Gross domestic product measured in current dollars. weight The importance attached to an item within a group of items.
NOMINAL VERSUS REAL GDP CALCULATING REAL GDP
NOMINAL VERSUS REAL GDP base year The year chosen for the weights in a fixed-weight procedure. fixed-weight procedure A procedure that uses weights from a given base year.
NOMINAL VERSUS REAL GDP CALCULATING THE GDP DEFLATOR The GDP deflator is one measure of the overall price level. The GDP deflator is computed by the Bureau of Economic Analysis (BEA). Overall price increases can be sensitive to the choice of the base year. For this reason, using fixed-price weights to compute real GDP has some problems.
NOMINAL VERSUS REAL GDP THE PROBLEMS OF FIXED WEIGHTS The use of fixed-price weights to estimate real GDP leads to problems because it ignores: • Structural changes in the economy. • Supply shifts, which cause large decreases in price and large increases in quantity supplied. • The substitution effect of price increases.
LIMITATIONS OF THE GDP CONCEPT GDP AND SOCIAL WELFARE Society is better off when crime decreases; however, a decrease in crime is not reflected in GDP. An increase in leisure is an increase in social welfare, but not counted in GDP. Nonmarket and household activities are not counted in GDP even though they amount to real production.
Unemployment Measuring Unemployment employed Any person 16 years old or older (1) who works for pay, either for someone else or in his or her own business for 1 or more hours per week, (2) who works without pay for 15 or more hours per week in a family enterprise, or (3) who has a job but has been temporarily absent with or without pay. unemployed A person 16 years old or older who is not working, is available for work, and has made specific efforts to find work during the previous 4 weeks.
Unemployment Measuring Unemployment not in the labor force A person who is not looking for work because he or she does not want a job or has given up looking. labor force The number of people employed plus the number of unemployed. labor force = employed + unemployed population = labor force + not in labor force
Unemployment Measuring Unemployment unemployment rate The ratio of the number of people unemployed to the total number of people in the labor force. labor force participation rate The ratio of the labor force to the total population 16 years old or older.
Unemployment Measuring Unemployment
Unemployment Components of the Unemployment Rate Discouraged-Worker Effects discouraged-worker effect The decline in the measured unemployment rate that results when people who want to work but cannot find jobs grow discouraged and stop looking, thus dropping out of the ranks of the unemployed and the labor force.
Unemployment Components of the Unemployment Rate The Duration of Unemployment
Unemployment The Costs of Unemployment Some Unemployment Is Inevitable When we consider the various costs of unemployment, it is useful to categorize unemployment into three types: • Frictional unemployment • Structural unemployment • Cyclical unemployment
Unemployment The Costs of Unemployment Frictional, Structural, and Cyclical Unemployment frictional unemployment The portion of unemployment that is due to the normal working of the labor market; used to denote short-run job/skill matching problems. structural unemployment The portion of unemployment that is due to changes in the structure of the economy that result in a significant loss of jobs in certain industries.
Unemployment The Costs of Unemployment Frictional, Structural, and Cyclical Unemployment natural rate of unemployment The unemployment that occurs as a normal part of the functioning of the economy. Sometimes taken as the sum of frictional unemployment and structural unemployment. cyclical unemployment The increase in unemployment that occurs during recessions and depressions.
Unemployment The Costs of Unemployment Social Consequences In addition to economic hardship, prolonged unemployment may also bring with it social and personal ills: anxiety, depression, deterioration of physical and psychological health, drug abuse (including alcoholism), and suicide.
THE CONSUMER PRICE INDEX The consumer price index (CPI)is a measure of the overall cost of the goods and services bought by a typical consumer. The Bureau of Labor Statisticsreports the CPI each month. It is used to monitor changes in the cost of living over time.
How the Consumer Price Index Is Calculated 1. Fix the basket. Determine what prices are most important to the typical consumer. a. The Bureau of Labor Statistics (BLS) identifies a market basket of goods and services the typical consumer buys. b. The BLS conducts monthly consumer surveys to set the weights for the prices of those goods and services. 2. Find the prices.Find the prices of each of the goods and services in the basket for each point in time. 3. Compute the basket’s cost. Use the data on prices to calculate the cost of the basket of goods and services at different times. 4. Choose a base year and compute the index. a. Designate one year as the base year, making it the benchmark against which other years are compared. b. Compute the index by dividing the price of the basket in one year by the price in the base year and multiplying by 100.
How the Consumer Price Index Is Calculated 5. Compute the inflation rate. The inflation rate is the percentage change in the price index from the preceding period. The inflation rate is calculated as follows: