Download
1 / 22
230 likes | 645 Vues
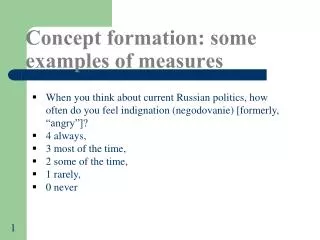
Concept formation: some examples of measures. When you think about current Russian politics, how often do you feel indignation (negodovanie) [formerly, “angry”]? 4 always, 3 most of the time, 2 some of the time, 1 rarely, 0 never. 1. Concept formation.

E N D
Concept formation: some examples of measures • When you think about current Russian politics, how often do you feel indignation (negodovanie) [formerly, “angry”]? • 4 always, • 3 most of the time, • 2 some of the time, • 1 rarely, • 0 never 1
Concept formation • Do you feel that most of the things that happen to you are the result of your own decisions or of things over which you have no control? own decisions, no control Do you feel this way strongly or only somewhat? • 4 own decisions, strongly • 3 own decisions, somewhat • 2 no control , somewhat • 1 no control , strongly 2
Concept formation • Do you feel that most of the things that happen to you are the result of your own decisions or of things over which you have no control? own decisions, no control Do you feel this way strongly or only somewhat? • 4 own decisions, strongly • 3 own decisions, somewhat • 2 no control , somewhat • 1 no control , strongly 3
Questions • Which is the mode? • A. the average • B. the middle point of the data • C. the most common occurring point • D. there are two modes 5
Questions • Which country puts out the most C02 per capita? • A. China • B. Brazil • C. The U.S. • D. The U.S puts out more, but not per capita. 6
The Mean (or Average) • The sum of all of the numbers in a set, divided by the number in the set • There are 8 students in a class. • Grades on the exam were 63, 72, 84, 89, 96, 96, 99, 100 • The average is • (63+ 72 +84 + 89 + 96 + 96 + 99 + 100) / 8 = 87.4 7
The Median • The middle number in the data set. • The median is the middle value if there are an odd number of cases. • The median is the average of the two middle values if there are an even number of cases. • There are 8 students in a class. • Grades on the exam were • 63, 72, 84, 89, 92, 96, 99, 100 • The median is • (89 + 92) / 2 = 90.5 8
The Median 9 R code: qqPlot(rqpol, dist=“norm”) Stata code: quantile rqpol
The Mode • The most frequently occurring value. • There are 8 students in this class. • Grades on the exam were • 63, 72, 84, 89, 96, 96, 99, 100 • The mode is 96 10
Skew Distributions with positive skews are more common than distributions with negative skews. One example is the distribution of income. Most people make under $40,000 a year, but some make quite a bit more with a small number making many millions of dollars per year. The positive tail therefore extends out quite a long way whereas the negative tail stops at zero. 16
Example of mean and median http://bcs.whfreeman.com/ips4e/cat_010/applets/meanmedian.html 17
Skew Distributions with positive skews are more common than distributions with negative skews. One example is the distribution of income. Most people make under $40,000 a year, but some make quite a bit more with a small number making many millions of dollars per year. The positive tail therefore extends out quite a long way whereas the negative tail stops at zero. 18
Skew Negatively skewed distributions do occur, however. Consider this plot of actual test grades on a statistics test where most students did very well but a few did poorly. It has a large negative skew. 20