
Introduction
h. Soap-film bubble. 2D sinusoid interface. Retractable injector. Oscillating pistons. Shock-bubble interaction configuration. Richtmyer-Meshkov instability configuration. Experiments and Computations for Inertial Confinement Fusion-Related Shock-Driven Hydrodynamic Instabilities

Introduction
E N D
Presentation Transcript
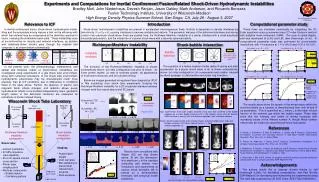
h Soap-film bubble 2D sinusoid interface Retractable injector Oscillating pistons Shock-bubble interaction configuration Richtmyer-Meshkov instability configuration Experiments and Computations for Inertial Confinement Fusion-Related Shock-Driven Hydrodynamic Instabilities Bradley Motl, John Niederhaus, Devesh Ranjan, Jason Oakley, Mark Anderson, and Riccardo Bonazza Fusion Technology Institute, University of Wisconsin-Madison High Energy Density Physics Summer School, San Diego, CA, July 29 - August 3, 2007 Fusion Technology Institute UW-Madison Relevance to ICF Introduction Computational parameter study In inertial confinement fusion, shock-driven hydrodynamic instab-ilities and the associated mixing impose a limit on the efficiency with which fuel material may be compressed to the densities required for fusion, reducing the obtainable fusion yield. These instabilities arise at nonuniformities on density and material interfaces, as ablative and radiatively-driven shocks pass through the material and compress it, as shown below schematically. In the present work, the phenomenology, mechanisms, and spatial and temporal scales of shock-driven instabilities are investigated using experiments in a gas shock tube environment, along with numerical simulations. In the shock tube environment, hydrodynamic phenomena may be characterized much more precisely than at ICF conditions, due to differences in conditions listed in the table above. Further, the absence of electric and magnetic fields, phase changes, and radiation allows purely hydrodynamic effects to be studied independently. Here, geometric length scales of the deformed interfaces are measured as indications of shock-induced mixing. Shock-driven hydrodynamic instabilities are present in accelerated inhomogeneous flows. Vorticity is deposited on density interfaces by baroclinicity , causing interfaces to become unstable and deform. The geometric features of the deformed interfaces and mixing zones in two particular shock-driven flows are studied here: the Richtmyer-Meshkov instability of a planar interface with a small-amplitude sinusoidal perturbation, and the interaction of a planar shock wave with a discrete spherical bubble. These flows are simulated numerically by integrating the 3D Euler equations using a piecewise-linear 2nd-order Godunov method with adaptive mesh refinement (AMR). The code is called Raptor, and was developed at LLNL and LBL (see Greenough, et al.). A computational parameter study was performed for shock-bubble interactions, with 14 scenarios at 1.14 ≤ M ≤ 5 and -0.76 ≤ A ≤ 0.61. Richtmyer-Meshkov instability Shock-bubble interaction He bubble in air: A = -0.76 Ar bubble in N2: A = 0.18 p Mi D Mr Bubble distortion w (-) w (+) Instability evolution p D Mi Wt = transmitted shock wave speed R = initial bubble radius r D r w (+) w (-) D Mt Radiative heating Ablation Compression Thermo-nuclear burn (a) (b) (c) (a) (b) (c) (d) (e) The evolution of a helium bubble of initial radius R during and after acceleration by a planar shock wave in air is shown schematically above: (a) initial configuration; (b) compression and rotation induced by shock passage; (c) deformation and vortex ring formation. The evolution of the Richtmyer-Meshkov instability is shown schematically above:(a) initial configuration just prior to shock, (b) linear growth regime, (c) start of nonlinear growth, (d) appearance of mushroom structures, and (e) turbulent mixing. Below are images generated using planar laser diagnostics (PLIF or Mie scattering) from shock tube experiments studying the Richtmyer-Meshkov instability for a 2D sinusoidal interface between nitrogen (with flow tracer) above and SF6 below. t t Kr bubble in air: A = 0.49 R12 bubble in air: A = 0.61 5 cm = post-shock particle velocity t = 13 ms t = 35 ms t = 70 ms t = 113 ms t = 230 ms B = bubble-fluid region (f≠ 0) t = 1.3 t = 4.0 t = 7.7 t= 11.6 t= 23.8 Experiment r f = bubble-fluid volume fraction w Wisconsin Shock Tube Laboratory N2(acetone) / SF6 M = 1.26 t t k = perturbation wavenumber The results above show the growth of the mixed region within the shocked bubble as a function of dimensionless time, with M and A as parameters. This is quantified as z, where z is the mean volume fraction of the ambient gas within the bubble region. These data show that the intensity and extent of mixing increases with increasing values of the Atwood number A, though Mach number effects may be scaled out using the post-shock flow speed. 8cm Driver (high pressure) N2(smoke) / SF6 M = 2.05 t = 1.3 t = 4.1 t = 7.7 t = 11.5 t = 23.6 Raptor (2D) Top: experimental shock tube images obtained using laser light scattered at the bubble midplane for a helium bubble shocked at M = 2.95. Bottom: results from 3D Eulerian AMR simulations: density (left) and vorticity magnitude (right) at bubble midplane. Below: late-time experimental and numerical images showing multiple vortex rings and complex structure. Left: helium volume fraction ( f ); right: vorticity magnitude (w). 2 m τ= 0.00 τ= 4.66 τ= 8.79 8 cm 7.2 m Diaphragm References r f1 τ= 0.00 τ= 1.54 τ= 3.29 τ= 3.98 τ= 4.16 D. Ranjan, J. Niederhaus, B. Motl, M. Anderson, J. Oakley, and R. Bonazza, Experimental investigation of primary and secondary features in high Mach number shock-bubble interaction, Phys. Rev. Lett., in review (2006). D. Ranjan, M. Anderson, J. Oakley, and R. Bonazza, Experimental investigation of a strongly shocked gas bubble, Phys. Rev. Lett., 94 (2005). J. Niederhaus, D. Ranjan, J. Oakley, M. Anderson, and R. Bonazza, Inertial-Fusion-Related Hydrodynamic Instabilities in a Spherical Gas Bubble Accelerated by a Planar Shock Wave, Fusion Science and Technology 47, 4 (2005), p. 1160. J. Greenough, J. Bell, and P. Colella, An adaptive multi-fluid interface capturing method for compressible flows in complex geometry, AIAA Paper 95-1718. Shock wave propagation • Shock tube: • Vertical orientation • 20 MPa impulsive load capability • 25.4 cm square internal cross section • Planar laser imaging ports • Modular components: • Bubble injector • Oscillating pistons τ= 0.00 τ= 1.53 τ= 3.27 τ= 3.95 τ= 4.22 • Imaging: • Pulsed laser sheets • CCD cameras • Mie scattering or planar laser induced fluor-escence • Dual exposure t = 430 ms t = 721 ms t = 725 ms t = 46.3 t = 45.6 t = 63.5 t = 63.5 t = 69.5 t = 71.6 Results from simulations with Raptor (2D) are also shown above, At left, the dimension-less amplitude h of the interface (excluding wall effects) from simulations and experiments at various shock strengths (M) is plotted on a dimensionless timescale, with analytical model predictions. f w 100 max [log scale] h / (2R) 0 Acknowledgements The authors would like to express sincere thanks to Jeff Greenough (LLNL), for facilitating computations, and Paul Brooks (UW-Madison) for developing and maintaining the experimental setup. This work was supported by US DOE Grant #DE-FG52-03NA00061. 10-6 -max Diagnostic laser sheet t = 65.7 t = 63.5 t = 71.6 t M = 2.95 M = 2.08 M = 1.4 Light source Late-time images for varying Mach number.


