Download
1 / 27
270 likes | 295 Vues
Evaluate software testing methods, decision-making processes, and fault seeding techniques. Examine Parnas's article on safety-critical software, including main points and key terms. Discuss challenges in software reliability and necessary reviews with a focus on operational profiles.

E N D
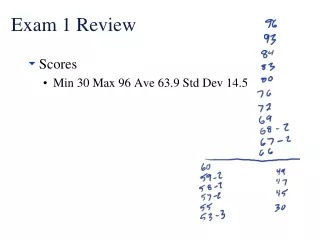
Exam 1 Review • Scores • Min 30 Max 96 Ave 63.9 Std Dev 14.5
Q1 Calculations – given the following table, compare the estimates of the E(Q) using the MFR est and using the subdomain formula. Assume that subdomain c is three times as likely as the other subdomains. You can simplify the table by “projections” on each axis. Show your work. State and justify any assumptions that you must make. Which formula do you think best estimates the actual E(Q) and why?
Q2 Assume that a testing method, called X, requires that for each decision one test case is randomly picked from the subset that makes the decision false, one from the subset that makes the decision true and one from the subset that makes the two sides equal (e.g. if the decision was “x < y”, that set would be those points where the value of x was equal to the value of y). X testing for the whole program would do this for each relational expression.
Q2 comments There were 6 subdomains. Three from the first decision. Three from the second decision. No mention is made of being mutually exclusive. Since the testing was by subdomains, the best choice was the product formula. Common mistakes were using 2 or 3 subdomains.
Q3 Find the largest set of mutually-exclusive subdomains that might be useful for thorough testing of the code. Justify why they would be useful. Express the sets with relational conditions on a and b and draw a 2D map of the subdomains. Consider these three faults: 1) change “b > 3” to “b > 2” ; 2) change “a > b” to “a >= b” ; 3) change “a-2” to “a-3” Can these subdomains reveal these faults?
Q4 Suppose that your company is considering buying a triangle program that identifies whether the 3 inputs are the sides of a scalene, isosceles, equilateral, bad inputs or not a triangle. Your boss wants you to test the new program before he purchases the software, but he will allow you only 3 test cases. The company knows that misclassifying any triangle will cost the company X dollars but classifying an equilateral triangle as scalene will cost an additional 2X dollars. How do you decide which tests to use? Can you use seeded faults to help select? If so, what faults would you seed?
Q4 comments The question asks for a decision or a decision process. If you don’t have a decision about which tests to do (and a justification), you need a process. If seeding faults (and you would need to say which faults you would seed), how do you use that information. For example, “I would choose tests that eliminated the most faults”. Just saying “I would seed faults” or “I would pick high q” is not sufficient
Evaluation of Safety Critical Software David L. Parnas, C ACM, June 1990
Overview of Parnas’s article • What was the main point? • What did you learn? • What did you find confusing? • Has anything changed since 1990?
Initial Faults • As a rule software systems do not work well until they have been used, and have failed repeatedly, in real applications. Generally, many uses and many failures are required before a product is considered reliable. Software products, including those that have become relatively reliable, behave like other products of evolution-like processes; they often fail, even years after they were built, when the operating conditions change.
Terms • Safety critical • Weak link behavior • Silver bullet • Clean room development • Trustworthiness
Software Controllers • It is important to recognize that, in theory, software implemented controllers can be described in exactly the same way as black box mathematical models. They can also be viewed as black boxes whose output is a mathematical function of the input. In practice, they are not viewed this way. One reason for the distinction is that their functions are more complex (i.e. harder to describe) than the functions that describe the behavior of conventional controllers. However, [4] and [17] provide ample evidence that requirements for real systems can be documented in this way.
Difficulties • Why is software hard to test • Software Testing Concerns • Software Reviewability Concerns
Software Reliability • Nonetheless, our practical experience is that software appears to exhibit stochastic properties. It is quite useful to associate reliability figures such as MTBF (Mean Time Between Failures) with an operating system or other software product. Some software experts attribute the apparently random behavior to our ignorance. They believe that all software failures would be predictable if we fully understood the software, but our failure to understand our own creations justifies the treatment of software failures as random.
Operational Profile? • For systems that function correctly only in rare emergencies, we wish to measure the reliability in those situations where the system must take corrective action, and not include data from situations in which the system is not needed. The input sequence distributions used in reliability assessment should be those that one would encounter in emergency situations, and not those that characterize normal operation.
Error counts • In other words, even if we could count the number of errors, reliability is not a function of the error count. If asked to evaluate a safety-critical software product, there is no point in attempting to estimate or predict the number of errors remaining in a program
Table 1 Table I shows that, if our design target was to have the probability of failure be less than 1 in 1000, performing between 4500 and 5000 tests (randomly chosen from the appropriate test case distribution) without failure would mean that the probability of an unacceptable product passing the test was less than 1 in a hundred.
1 minute paper • What issues/concerns/opinions/questions do you have about the Parnas paper?