
-0.2
PEEP 10-5 r = 0.08. p<NS. PEEP 10-5 r = 0.3 p<NS. PEEP 15-5 r = 0.31 p<NS. PEEP 15-5 r = 0.618 p<0.05. 0.15. 0.15. 0.1. 0.1. 0.05. ∆ PaCO2%. 0.05. ∆ PaCO 2 %. 0. 0. 0.6. 1.2. 0.6. 1.2. 1.8. -0.05. -0.05. -0.1. -0.1. -0.15. -0.15. ∆ EELV 0 %. ∆ LV 20-abs %. -0.2. -0.2.

-0.2
E N D
Presentation Transcript
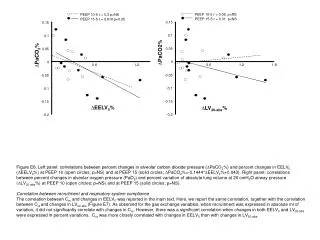
PEEP 10-5 r = 0.08. p<NS PEEP 10-5 r = 0.3 p<NS PEEP 15-5 r = 0.31 p<NS PEEP 15-5 r = 0.618 p<0.05 0.15 0.15 0.1 0.1 0.05 ∆PaCO2% 0.05 ∆PaCO2% 0 0 0.6 1.2 0.6 1.2 1.8 -0.05 -0.05 -0.1 -0.1 -0.15 -0.15 ∆EELV0% ∆LV20-abs% -0.2 -0.2 Figure E6. Left panel: correlations between percent changes in alveolar carbon dioxide pressure (∆PaCO2%) and percent changes in EELV0 (∆EELV0%) at PEEP 10 (open circles; p=NS) and at PEEP 15 (solid circles; ∆PaCO2%=-0.1444*∆EELV0%+0.043). Right panel: correlations between percent changes in alveolar oxygen pressure (PaO2) and percent variation of absolute lung volume at 20 cmH2O airway pressure (∆LV20‑abs%) at PEEP 10 (open circles; p=NS) and at PEEP 15 (solid circles; p=NS). Correlation between recruitment and respiratory system compliance The correlation between Crs and changes in EELV0 was reported in the main text. Here, we report the same correlation, together with the correlation between Crs and changes in LV20-abs (Figure E7). As observed for the gas exchange variables, when recruitment was expressed in absolute ml of variation, it did not significantly correlate with changes in Crs. However, there was a significant correlation when changes in both EELV0 and LV20-abs were expressed in percent variations. Crs was more closely correlated with changes in EELV0 than with changes in LV20-abs.