Download
1 / 19
190 likes | 314 Vues
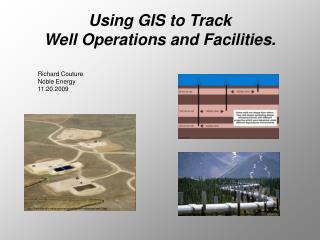
Using GIS to Track Well Operations and Facilities. Richard Couture Noble Energy 11.20.2009. http://files.skytruth.org/googleearth/kmlfilerefs/Images/wellpad-3.jpg. http://www.solarstorms.org/Pictures/AlaskanPipeline.jpg. Background: Why do we care?.

E N D
Using GIS to Track Well Operations and Facilities. Richard CoutureNoble Energy11.20.2009 http://files.skytruth.org/googleearth/kmlfilerefs/Images/wellpad-3.jpg http://www.solarstorms.org/Pictures/AlaskanPipeline.jpg
Background: Why do we care? • 1999-2004: Applications for drilling operations nearly tripled from 1803 to 6399 applications record commodity prices. • Activity has slowed but the impact is still there. The scrutiny came with increased activity and although the activity has decreased the scrutiny has not. • We are required to track, report, and distribute our data. • Wealth of data to track. Wells and pipelines and where they are….that is the easy part. • GIS allows us to model the real world: In the real world…wells and pipelines/meters are not simply vectors (points and lines). They have properties or attributes.
Background: Why do we care? • The difficult part is the specific data including attributes: where, type, diameter, etc. • Technology has evolved: data storage, computing cost and capacity. • We need to track all of this data at great expense. • Operations database (Wellview, Wellcore, OpenWells, etc.). • Our DB with no spatial context (geometry, spatial reference). Has lat/long info.
Background: Three main issues • Take Operations DB, connect to GIS projects and display operations data in real-time. • Improve pipeline/meter datasets and display SCADA information. • Find a way to display data in an efficient format.
Methodology: Planning • Operations DB: • Held meetings with managers and engineers to decide what they wanted to target in the Wellview DB (Oracle). • Decided to keep it simple. • Start small and get it working….then expand project scope. • Target Daily Operations and Daily Costs. • See what we are doing and display operations. • See what we are spending and display costs. • Goal: Set out to build an ArcMap project that had a connection to the Wellview DB, and had the ability to display operations including daily operations and daily costs. This operations dataset should be efficiently updated.
Methodology: Planning • SCADA DB: • Held similar meeting to discuss how to represent pipeline and meter data and what data to target in the SCADA system (SQL Server DB). • Once again…keep it simple. • Started by building new pipeline and meter datasets that incorporate attributes. • Target casing, tubing, and line PSI. • SCADA DB has a “tag” for each type for each well. • Goal: Build new pipeline tracking datasets. Build an ArcMap project that incorporates new pipeline and meter datasets. Link daily export from SCADA DB that is linked to project. Gives engineers and managers a new way to display and visualize information.
Methodology: Operations • Worked with IT personnel to develop way to connect to DB. • Built “view” of Wellview's well header table. • Chose the well header table as a sort of “home base” as it relates back to every table via primary key (idwell). • Built ODBC connection (Open Database Connectivity). IT group will have to provide necessary info for security and access information.
Methodology: Operations • In ArcMap we chose the “Add Data” option and connected the view to the project via the ODBC connection as a point-event layer. • Add DataDatabase ConnectionsViewname • Once added, we needed to “Display XY Data”. • Right-clkDisplay XY Data • This is us basically telling ArcMap which fields in the view represent the lat/long field.
Methodology: Operations • Now have a “live” connection to our operations DB. When someone adds a well (with lat/longs) in Wellview…the well is added to the project layout.
Methodology: Operations • Daily Operations: In Wellview, built custom multi-well report that selects our targeted data including the primary key (idwell). • Used custom SQL to select wells with activity 24-hour activity wells. • Opened custom report with selected wells in Excel. • Exported custom multi-well report to .dbf. • Added .dbf to ArcMap layout and created a “Join” between Wells layer and the custom report. • Right-clkJoins and RelatesJoinJoin attributes from a table • Join the tables on the primary key field (idwell)
Methodology: Facilities • Had surveyors update and send us new pipeline vectors. • Built a new shapefile with attributes for our Noble pipelines. • Diameter, type, status, etc. • Built meter dataset to link to SCADA DB. • Meter dataset includes 3 separate fields with “tags” from SCADA system. (More “joins”) • Used 3rd party software to export daily report from SCADA DB. (Active Factory). • 3 Reports (.dbf)- 1 Casing PSI, 1 Tubing PSI, 1 Line PSI.
Methodology: Facilities • Added the three exported reports (.dbf) to the ArcMap SCADA project. • CASING_PSI.dbf, TUBING_PSI.dbf, LINE_PSI.dbf • Daily reports = daily numbers (last data point) • Built a join for each report. • Right-clkJoins and Relates JoinJoin attributes from a table • Joined the tables on the fields containing the tag names.
Methodology: Facilities • Active Factory: We are able to create a custom SQL statement and export the reports each day. • The daily update should overwrite the previous report and you will have a project that displays pipelines, meters, as well as their most recent casing, line and tubing pressures values. • We have had a great deal of positive feedback on this project. And hope to expand the project to other areas and attempt to further automate this process including some quantitative analysis.
Distributing the Data: • We have plans to work within the framework of ArcGIS Server 9.3 and publish these maps using a FLEX implementation. • For now: ArcReader: • Publish maps/data packages maps on shared drive. • Basic map interaction. • Basic access to tools. • Easy to update. • Web-based Map Implementation • Planned for next year. • Publish map services (wms). • Store and serve data on our server.
Project Conclusions: • Both pieces of this project have resulted in useful tools for our Northern Rockies team. • Previously, we had access to this info in spreadsheet, table, or some other report. Now we can visualize…simple data, bubble maps, costs, tubing/line pressure, etc. • We are now able to display this data in a spatial context and in a way that makes sense. • We also are able to distribute this information more efficiently and this does not leave anyone “out in the cold”. Those who want their paper map or PDF can still have them.
General Conclusions: • GIS is about finding a way to accomplish our goal. We set out find a way to visualize real-time data….we were able to use existing infrastructure in order to accomplish that goal. • Planning in GIS is the key…sit down, communicate, share, and make a plan. It is important to anticipate what problems may arise. • There is NO one way to do this… there are better more efficient ways to set up the project, but this is an iterative process. • Ex. We plan one working on the SCADA portion of the project to create the same ODBC connection. (live connection)
Any questions or feedback? Rick Couture Noble Energy, Inc. O: 303.228.4163 C: 303.638.9962 rcouture@nobleenergyinc.com I love to talk about GIS, GIS ideas, GIS education, etc. If you have any questions, concerns, ideas, or feedback please get in touch. The best way to learn is to communicate and share ideas.