Goodness of Fit in Statistical Analysis
Learn about the importance of accurate teaching in statistics, avoiding common misconceptions like R2 as a measure of goodness of fit. Discover the true methods for assessing model fit and variance explained.


Goodness of Fit in Statistical Analysis
E N D
Presentation Transcript
Teaching wrong is wrong teaching Janez Stare Faculty of Medicine, Ljubljana
The worst that a teacher can do is to teach something that is not true.
I can think of two causes for wrong teaching: we misunderstand something (p value, ci) we believe something because literature says so, but it is wrong. The second cause is much more dangerous, as statistical literature is littered with wrong statements. And sometimes wrong statements persist for many years and become accepted truths. In this lecture I will give you one example (and mention another one).
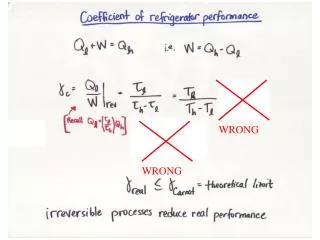
The only formulas R2is a measure ofexplained variation!
More misunderstanding of R2 Many people think of R2 as a measure of goodness-of-fit. This is a good example of how internet ‘helps’ spreadingthe mistake.
Goodness of FitI've already introduced the concept of goodness of fit for simple linear regression. I stated that the correlation is a good way to describe it, and that 100x the square of the correlation--the percent of variance explained--is also used. Now that you know about residuals, I can explain goodness of fit a bit more. Obviously, the smaller the residuals, the better the fit. One measure of the magnitude of the residuals is their standard deviation, alias the root mean square error. But what can we compare the error with to get a generic measure of goodness of fit? Answer: the standard deviation of the dependent variable itself, before we try to fit any model. This standard deviation represents the amount of variation in the dependent variable, and the error represents the variation that's left over after we fit the model. But statisticians like to make things complicated, right? So they square the standard deviation to get total variance, and they square the error to get error variance. The total variance minus the error variance is... wait for it... the variance explained by the model. Divide the variance explained by the total variance and you have something equivalent to the square of a correlation coefficient--we call it the goodness-of-fit R2for the model. Multiply it by 100, and you have... the percent of total variance explained by the model, or just the percent of variance explained. Cool!
R2 = 0.59 R2 = 0.85
True model: Fitted model: R2 = 0.33
True model: Fitted model: R2 = 0.72
True model fitted R2 = 0.87
Goodness of fit Answer to the question: Could our model have generatedthe data? Karl Pearson (1900). On the Criterion That a Given System of Deviations From the Probable in the Case of a Correlated System of Variables Is Such That It Can Be Reasonably Supposed to Have Arisen From Random Sampling. Philosophical Magazine.
Misunderstanding of R2 in survival analysis • Properties • How we study those properties
An example of (possible) misinterpretation of statistical data
Died Aged Average age then Sinatra 1996 81 73,2 Legendre 1833 81 43,4
Died Aged Average age then Klestil 2004 72 75,7 Lindbergh 1974 72 68,2
Comparison of net survival • is another example of using wrong methods for decades. • but • we have no more time ...