The Hipster
60 likes | 83 Vues
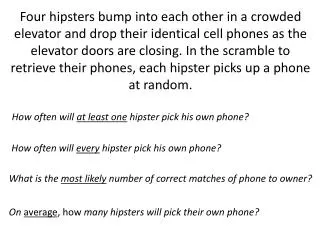
The Hipster. A Totally Hip Infographic. Use this text box to write a brief introduction for your infographic. What’s the topic? Where’d you get the data?. Use this text box to provide a nugget of new information or to describe the data shown above (or below). 50%. 12x.

The Hipster
E N D
Presentation Transcript
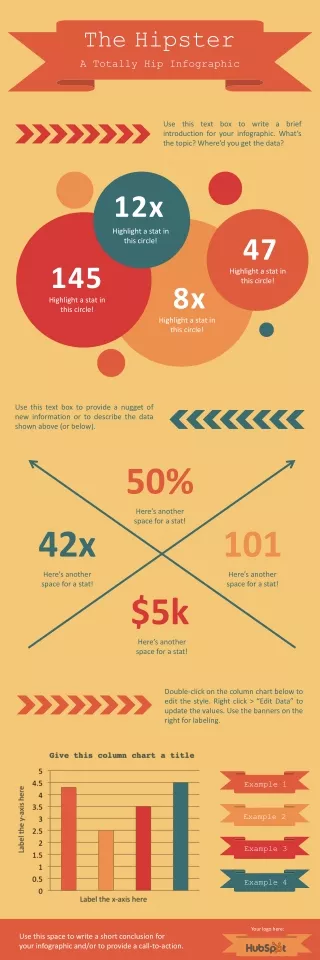
TheHipster A Totally Hip Infographic Use this text box to write a brief introduction for your infographic. What’s the topic? Where’d you get the data? Use this text box to provide a nugget of new information or to describe the data shown above (or below). 50% 12x Here’s another space for a stat! Highlight a stat in this circle! 47 42x 101 145 Highlight a stat in this circle! 8x Here’s another space for a stat! Here’s another space for a stat! Highlight a stat in this circle! $5k Highlight a stat in this circle! Here’s another space for a stat! Double-click on the column chart below to edit the style. Right click > “Edit Data” to update the values. Use the banners on the right for labeling. Example 1 Example 2 Example 3 Example 4 Your logo here: Use this space to write a short conclusion for your infographic and/or to provide a call-to-action.
SO MUCH TO SAY Does your infographic idea require a lot of writing? Use this template to fit in all the important information you need to convey. Simply replace the lorem ipsum placeholder text with your own fabulous copy, customize the colors, and maybe add in a few graphics or stats to complete your masterpiece! WRITE A SECTION HEADER HERE Lorem ipsum dolor sit amet, consectetur adipiscing elit, sed do eiusmod tempor incididunt ut labore et dolore magna aliqua. Ut enim ad minim veniam, quis nostrud exercitation ullamco laboris nisi ut aliquip ex ea commodo consequat. Duis aute irure dolor in reprehenderit in voluptate velit esse cillum dolore eu fugiat nulla pariatur. WRITE A SECTION HEADER HERE Lorem ipsum dolor sit amet, consectetur adipiscing elit, sed do eiusmod tempor incididunt ut labore et dolore magna aliqua. Ut enim ad minim veniam, quis nostrud exercitation ullamco laboris nisi ut aliquip ex ea commodo consequat. Duis aute irure dolor in reprehenderit in voluptate velit esse cillum dolore eu fugiat nulla pariatur. WRITE A SECTION HEADER HERE Lorem ipsum dolor sit amet, consectetur adipiscing elit, sed do eiusmod tempor incididunt ut labore et dolore magna aliqua. Ut enim ad minim veniam, quis nostrud exercitation ullamco laboris nisi ut aliquip ex ea commodo consequat. Duis aute irure dolor in reprehenderit in voluptate velit esse cillum dolore eu fugiat nulla pariatur. Use this space to write a short conclusion for your infographic and/or to provide a call-to-action. Your logo here:
THE FLOWCHART THE FLOWCHART Should you do this thing? Yes No Are you sure? How about this one? Yes No Yes No Do you want to do that thing? Yes No You don’t want to do anything, huh? Cool. Glad we’re on the same page. YES! DO THAT THING! Meh, maybe not. Your logo here: Use this space to write a short conclusion for your infographic and/or to provide a call-to-action.
Facts About TREES Trees are cool. People are cool. Here are some fake stats about trees and people. This is my home. 80% of birds need a tree to live in. Did you know? 94% of people in the US wish they could live in a tree house. Sharing is caring. 86% of trees like to share with their friends. Stand tall. The tallest tree in the world is one million feet tall. This stat is definitely not real. Don’t get your hopes up. Reduce, reuse, recycle. 24 Billion newspapers are printed every year in the US. This stat might be real. You can help. Here’s how: Use this space to write a short conclusion for your infographic and/or to provide a call-to-action, like “Go visit hubspot.com to learn more!” Your logo here:
The Timeline Here’s an infographic template for showcasing the history or evolution of a particular topic. Simply update the years in the circles below, replace the dummy text, and customize the images to suit your style. Placeholder Placeholder 2006 This is placeholder text. Write something interesting here! This is placeholder text. Write something interesting here! 2007 Placeholder Placeholder 2008 This is placeholder text. Write something interesting here! This is placeholder text. Write something interesting here! 2009 Placeholder Placeholder 2010 This is placeholder text. Write something interesting here! This is placeholder text. Write something interesting here! 2011 Placeholder Placeholder 2012 This is placeholder text. Write something interesting here! This is placeholder text. Write something interesting here! $ 2013 Placeholder Placeholder 2014 This is placeholder text. Write something interesting here! This is placeholder text. Write something interesting here! 2015 Use this space to write a short conclusion for your infographic and/or to provide a call-to-action. Your logo here:
THE DATA GEEK Here’s the perfect infographic template for highlighting data! Double-click on the charts and graphs below to edit the style. Right click and choose “Edit Data” to update the values. This pie chart is great for displaying percentages / parts of a whole. Use this text box to give some more context about the data you’re displaying. How is it helping to drive home your main point(s)? Is there anything confusing that needs to be explained in more detail? Use the line graph below to compare values over time. Like pie charts, these doughnut charts are great for showing parts of a whole. Use the bar chart below to compare values. Use this text box to give some more context about the data you’re displaying. How is it helping to drive home your main point(s)? Is there anything confusing that needs to be explained in more detail? Your logo here: Use this space to write a short conclusion for your infographic and/or to provide a call-to-action.