Download
1 / 10
100 likes | 233 Vues
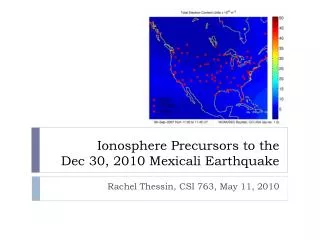
Ionosphere Precursors to the Dec 30, 2010 Mexical i Earthquake. Rachel Thessin, CSI 763, May 11, 2010. Question. Can ionosphere precursors to the Mexicali Earthquake can be detected in TEC data?

E N D
Ionosphere Precursors to the Dec 30, 2010 Mexicali Earthquake Rachel Thessin, CSI 763, May 11, 2010
Question • Can ionosphere precursors to the Mexicali Earthquake can be detected in TEC data? • Test 1: Does the periodogram taken over 1 day of data (at the earthquake location) vary significantly from normal in the days preceding the earthquake? • Test 2: Does the correlation between the earthquake grid cell and grid cells near and far to the earthquake vary significantly from normal in the days preceding the earthquake?
Data Overview • Earthquake: • December 30, 2009 (1848 UT), magnitude 5.8 • 32.464N 115.189W • Ionosphere Data • US TEC data from the National Geophysical Data Center • Aggregated in time and space from GPS ground data • 1 deg x 1 deg • 15 min resolution • March 2006 – December 2009 • TEC: total electron content (integral of electron density) http://www.ngdc.noaa.gov/stp/IONO/USTEC/
Test 1, 1 of 3 • Does the periodogram taken over 1 day of data (at the earthquake location) vary significantly from normal in the days preceding the earthquake? • Look for excursions outside 95% bounds
Test 1, 2 of 3 • Near-field defined as <311 km due to earthquake influence
Test 1, 3 of 3 • At earthquake site • Number of excursions per day is ~normal • Fewer number of excursions than typical • All excursions are in lower 2.5% tail of distribution • P(4 lower excursions in 1 day) = 3% (3 days before EQ) • P(no upper tail excursions over 10 days) = 0.0004% • At other sites • Also had mostly lower excursions • Most upward: 6 • 1.6% chance of six or fewer upward excursions in the ten days • Conclusion: “Signal” is indicating extremely low solar activity during earthquake period, not the earthquake
Test 2, 1 of 2 • Does the correlation between the earthquake grid cell and grid cells near and far to the earthquake vary significantly from normal in the days preceding the earthquake? • Nearby locations should normally be correlated, and lose correlation before the earthquake • Far locations should be less correlated, and thus less affected by any precursor signal
Test 2, 2 of 2 • Low correlation values (statistically speaking) at all locations except Flagstaff • Confirmed with Kolmogorov-Smirnov Test: the data are not consistent with being drawn from the same continuous distribution as a uniformly distributed data set • Conclusion: Because far-field results and near-field results are both anomalous, we are unable to conclusively link the change in correlation to the earthquake.
Conclusion • Precursor signals cannot be conclusively found in this data set • Future tests: • Higher solar activity • One GPS station per test location • Avoid problems with aggregate data • Better spatial and temporal resolution • More test locations further from earthquake but in same time zone