Download
1 / 37
380 likes | 672 Vues
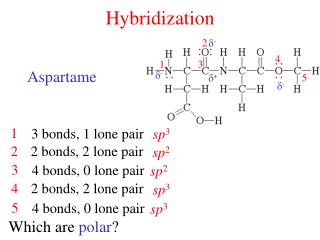
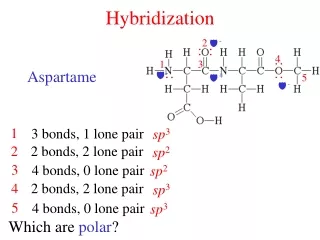
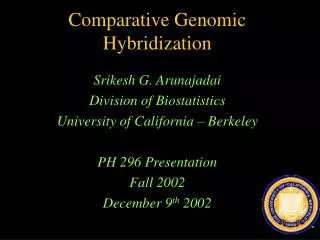
Comparative Genomic Hybridization. Srikesh G. Arunajadai Division of Biostatistics University of California – Berkeley PH 296 Presentation Fall 2002 December 9 th 2002. OUTLINE. CGH – Introduction Methodology , Analysis and Interpretation Application 1 - BT474

E N D
Comparative Genomic Hybridization Srikesh G. Arunajadai Division of Biostatistics University of California – Berkeley PH 296 Presentation Fall 2002 December 9th 2002
OUTLINE • CGH – Introduction • Methodology , Analysis and Interpretation • Application 1 - BT474 • Application 2 - Bladder Tumors
Comparative Genomic Hybridization • Comparative genomic hybridization allows a comprehensive analysis of multiple DNA gains and losses in entire genomes within a single experiment • Genomic DNA from the tissue to be investigated, and normal reference DNA are differentially labeled and simultaneously hybridized in situ to normal metaphase chromosomes • By comparing the fluorescence intensities of test and control DNA, changes in signal intensities caused by imbalances of the test DNA can be identified • Previous methods are highly focused, they target one specific gene or chromosome region at a time and leave the majority of the genome unexamined.
Basic Assumption • Ratio of the binding intensities of test and control DNA is proportional to the ratio of the concentrations of sequences in the two samples.
A Very Important Application • Measurement of alterations in DNA copy number which are involved in developmental abnormalities and cancer • Down Syndrome – Extra copy of DNA sequences from a portion of chromosome 21 • Cancer – Changes in copy number are associated with changes in the gene expression that occur in tumor development. • Loss of DNA sequences contributes to the inactivation of tumor suppressor genes,while amplifications may activate oncogenes.
CGH • The regions of DNA that are altered in copy number are typically much larger than the important genes that are being affected, so there will be contiguous regions of the genome with constant copy number, with an abrupt step to different level at the edge of an aberration. • E.g..-If a portion of a chromosome is lost in the cell population we would expect a CH of this genomic DNA with Normal Genomic DNA to produce ratios that were constant for all array elements not in the deletion and half the value for elements mapping in the deletion.
Fundamental Measurement Limits • Ratio measurements are accurate • Insensitive to production Variability • Compensate for the many physical-chemical aspects of the measurement process that may vary among hybridizations. • Reassociation – of double stranded labeled molecules in hybridization solution • Non-Specific Binding – of the labeled molecules to array surfaces and cover slip • Diffusion limits – on the ability of the labeled molecules to find their complimentary targets • The proportion of binding sites in a spot that are hybridized. • IF THE LABELS DO NOT DIFFERENTIALLY AFFECT ANY OF THESE PROCESSES THEN IN PRINICIPLE THE RATIOS ARE ACCURATELY PRESERVED
Factors Affecting Ratio Measurements • Non-Specific Binding of labeled molecules to array spots • Differential non-specific binding to array spots and substrate surface which make determination of proper amount of Background Correction problematic • Signals from repetitive sequences • Problems with labeling the DNA • Defects in the detection system
Normalization • Perform a series of Normal Vs.Normal hybridizations to define the set of clones having consistently good hybridization quality and constant intensity ratios.
Array Production • Signal Intensity that is generated on an array spot is a function of – • Density of hybridizable DNA that is bound to the Spot • Ability of the labeled molecules to get to the spots that contain the complimentary sequences • Conditions of hybridization environment • Array used is made from ligation-mediated PCR products BAC clones.
Hybridization • Non-specific binding to the substrate is blocked by a short pre-hybridization with unlabeled salmon or herring DNA in hybridization buffer. • A slow rocking motion of 1-2 cycles per minute is provided to assist diffusion • Slides washed after hybridization and typically mounted in glycerol containing the DNA stain DAPI • Imaged in CCD Imaging System
Analysis and Interpretation • Ratio of the total fluorescence intensities of a spot is used as a measure of elative abundances of the nucleic acid sequences in the specimen. • Presence of copy number changes in the specimen can be detected even without mapping the data according to position in the Genome.
DNA Copy Number Profiles • Averaging the ratios of the triplicate spots for each clone • Normalizing them to the median of the log2 Ratios of the triplicate averages • Plotting them according to their positions in the Genome • Thus single copy changes, which ideally would result in a ratio of 0.5 for a deletion and 1.5 for a gain of a single chromosome, can be detected with very high precision
Ratios Depart from Ideal Value • Imperfect background corrections • Non-specific binding of labeled molecules to the array spots • Repetitive sequence content of the genome • Suppress the signal from the repetitive sequences by the inclusion of large amounts of unlabeled repetitive sequences in the hybridization. These reassociate with the labeled repetitive sequences and thus reduce their ability to contribute to the signal.
Relationship of measured ratio of DNA to copy number • Within one hybridization, the relationship of ratio and copy number is basically linear, except that the slope is slightly lower than ideal . • All autosomal clones behave with about the same slope because the ratio variation among clones at the same copy number is the same, independent of copy number
Ligation –Mediated PCR • Preparation and spotting of BAC DNA is problematic • BACs are single copy vectors • The yield of DNA from BAC cultures is low compared to that from plasmid-bearing cultures • Spotting high molecular weight DNA at sufficient concentration to obtain good ratio of signal to noise in the hybridization may be difficult. • Previous methods resulted in highly variable ratios,so that detecting single copy changes required averaging over several adjacent clones. Ligation Mediated PCR provide reliable data from single clones.
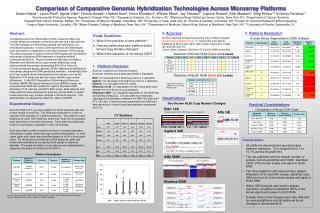
Application 1 (Pollack et.al.) • Genome-wide analysis of DNA copy-number changes using cDNA microarrays • Published array CGH methods have relied on large genomic clone (for example BAC) array targets and have covered only a small fraction of the human genome. cDNAs representing over30,000 radiation-hybrid (RH)–mapped human genes provide an alternative and readily available genomic resource for mapping DNA copy-number changes. • Analysis of DNA copy-number variation using cDNA microarrays would require a sensitivity of detection an order of magnitude greater than has been routinely reported
analyzing genomic DNAs from tumour cell lines with known gene amplifications or deletions. BT474 is a human breast cancer cell line in which ERBB2 is amplified. Genomic DNA BT474 Cy5 Normal Female genomic DNA Cy3 The average red/green fluorescence ratio of 4 independent cDNA elements representing ERBB2 on the array was 8.5 closely approximating (but slightly underestimating) the 10–15:1 ratio determined by Southern-blot analysis Feasibility of cDNA based CGH
the red/green fluorescence ratios measured for both autosomal and X-chromosomal genes were tightly distributed around a mean value of 1. In contrast, when we compared genomic DNA Comparing two Samples of Normal Female Genomic DNA
from a 45, XO (Turner syndrome) cell line (red) with normal female (46, XX) genomic DNA (green), the distribution of fluorescence ratios for X-chromosomal genes was shifted leftward (mean 0.72) reflecting the single-copy loss of X-chromosomal genes in the XO sample. Expected Value of mean = 1 Comparing with 45,XO (Turner Syndrome)
distributions of fluorescence ratios for X-chromosomal genes shifted rightward (means 1.31, 1.58 and 1.84, respectively reflecting X-chromosomal DNA copy-number gain. Expected Value of mean =1 Comparing with 47,XXX; 48,XXXX; 49,XXXXX
The mean fluorescence ratios for X-chromosomal genes obtained in the different experiments fitted tightly to a line with a regression correlation of 0.99, demonstrating that fluorescence ratios were linearly proportional to DNA copy number in this range of low-level gene amplification or single-copy deletion (in the case of XO versus XX). Relation between Fluorescence Ratios and DNA Copy number
Plot of Fluorescence ratios for each RH-mapped element on the array according to their RH map location on the genome
Application 2 ( Veltman et.al) • Array based CGH for high resolution mapping of copy number changes in different stages of bladder carcinogenesis in 41 primary human tumors. • Two arrays were used in this study. The first (Array1) consisted of 1777 clones covering the human genome at roughly a 1.5 Mb resolution . The second array (Array2) consisted of 380 clones specifically selected to contain important tumor suppressor and oncogene loci.
Method • Each tumor sample was hybridized to both arrays • Sixteen bit fluorescence intensity images were obtained using a CCD camera coupled to a 1X magnification optical system. • DNA spots were automatically segmented, local background was subtracted and the total intensity and the intensity ratio of the two dyes for each spot were calculated. Spots composed of less than 9 pixels, showing bad correlations of the two fluorescent dyes, or showing auto fluorescent particles over the target were discarded.
Data Analysis • A series of 8 normal vs. normal hybridizations was used to define the set of clones having consistently good hybridization quality • For each analysis, clones were excluded for which none or only one spot remained after the Genepix analysis. • For all analyses, the 5% of clones with the most extreme average test over reference ratio deviations from 1.0, and the 1% of • clones with the largest standard deviation in this set of normal controls was excluded. • This procedure resulted in the exclusion of 174 clones. • In addition, all X-chromosome clones were excluded from data analysis • The final set, on which all analyses were performed, contained 1747 clones.
Data Analysis • Log2 intensity ratios obtained for each array for each case were individually centered by subtracting the median of log2 intensity ratios for that case over all clones that met the quality control parameters described above. • Data on the two arrays was then merged into one dataset using the genomic mapping information from all clones. There were 19 clones in common on the two arrays. • A matched-pair t-test on each of the 19 revealed no clones to show significantly different ratios at the 5% level.
Statistical Analysis • Whether there were associations between copy number alterations and tumor stage or grade; • Whether gene pairs exhibited significant correlations; and • Whether gene pairs exhibited complementary or concordant behavior based on a categorical analysis.
Association Analysis • The association analyses consisted of statistical correlation with permutation-based assessment of significance, visualization by hierarchical clustering, and automatic pattern classification with cross-validation to assess predictive power.
thresholds of 0.2 and –0.2 (log2ratio) for calculating the frequencies of genomic copy number gains and losses, respectively, in the bladder tumor cases. Less than 10 out of the 1745 clones included in the final dataset crossed these thresholds for this control experiment. Quality of CGH Arrays
24 clones containing known bladder cancer oncogenes 22 non-overlapping clones that were most frequently aberrant The values of clones spanning the same gene were averaged. Permutation analysis was performed to establish the appropriate significance threshold for the correlation coefficient, significant correlations are highlighted by yellow squares. The color scale reaches full saturation in green for significant positive correlations (copy number gain in one clone combined with copy number gain in the other clone or copy number loss in one clone combined with copy number loss in the other clone) and full saturation in red for significant negative correlations (copy number gain in one clone combined with copy number loss in the other clone). Gene Correlation Matrix
Reference • Genome Wide Analysis of DNA Copy Number changes using cDNA Microarrays Pollack et.al. ,Nature Genetics, Sept 1999 • Assembly of Microarrays for Genome wide measurement of DNA copy number.Snijders et.al. • Technical Approaches for Efficient, High Precision Nucleic Acid Analysis using DNA ,Microarrays • Array-Based comparative genomic Hybridization for genome-wide screening of DNA copy number in bladder Tumors ,Veltman et.al
Thanks • Dr. Sandrine Dudoit , UCB • Dr.Jane Fridlyand , UCSF