Download
1 / 35
350 likes | 463 Vues
Benefits and Costs of California Partnership Academies. David Stern and Charles Dayton Career Academy Support Network UC Berkeley For CPA conference 14 Feb 2012. Overview. Findings from CASN study

E N D
Benefits and Costs of California Partnership Academies David Stern and Charles Dayton Career Academy Support Network UC Berkeley For CPA conference 14 Feb 2012
Overview • Findings from CASN study Charles Dayton, Candace Hamilton Hester, and David Stern: Profile of the California Partnership Academies 2009-10; Executive summary and full report available at http://casn.berkeley.edu/ • Findings from PACE study Ace Parsi, David Plank, and David Stern: Costs of California Multiple Pathway Programs; Report available at http://www.stanford.edu/group/pace/PUBLICATIONS/ TECHNICALREPORTS/2010_PR_PLANK_STERN.pdf 3.Policy implications
Number of CPAs operating in 2009-10, by year of start-up Total 467 academies with reports Total 48,436 students in grades 10-12
Sources of State funding: percentage of CPAs funded from each source, 2009-10
CPA and California 10th- to 12th-grade enrollment by race/ethnicity, 2009-10 and 2004-05
CPA and California 12th-grade graduation rates, 2009-10 and 2004-05
California State 12th-grade graduation rates, 2001-02 through 2008-09
CPA and California 12th-grade graduation rates by race/ethnicity, 2009-10
12th-grade CPA graduation rates by industry sector, 2009-10
Graduates reported to meet a-g subject requirements, 2009-10 and 2004-05
CPAs by category according to the reported percentage of juniors in mentorships, 2009-10 and 2004-05
CPAs by category according to the reported percentage of seniors in work-based learning, 2009-10
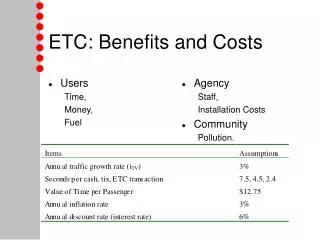
Benefits from higher graduation rate for CPA seniors Clive R. Belfield and Henry M. Levin: The Economic Losses from High School Dropouts in California (UC Santa Barbara: California Dropout Research Project Report #1, August 2007) compute fiscal and social benefit from an additional high school graduate, net of additional educational cost.
Fiscal benefit for California State and local taxpayers of one more high school graduate Discounted present value of lifetime benefit for one additional graduate, age 20 in 2005: $25,840 additional tax payments +29,510 reduced health expenditures +21,370 reduced crime expenditures +3,700 reduced welfare expenditures = $80,420 total benefit to State and local taxpayers ~ $93,229 in 2010 dollars
Higher graduation rate of CPA seniors repays State and local cost CPAs enrolled 12,132 seniors in 2009-10. Senior graduation rate was 10% higher in CPAs than statewide, so 1,213 more CPA seniors graduated than would have graduated at the statewide rate. Some of these 1,213 might have graduated on time even if they hadn’t been in CPAs. If 728 seniors graduated because they were in CPAs, the benefit they generated would exceed total taxpayer cost (728 X $93,229 > $67,814,732).
Additional benefits In addition to fiscal benefit to State and local taxpayers, Belfield and Levin also calculate other benefits from one more h.s. graduate (present value of lifetime benefits at age 20 in 2005): $115,300 net benefit to Federal government $188,640 additional after-tax earnings $79,890 reduced cost to crime victims, etc. These greatly exceed benefit to California taxpayers ($80,420 in 2005 dollars).
Cost of resources used in college-and-career pathways Ace Parsi, David Plank, and David Stern: Costs of California Multiple Pathway Programs (Policy Analysis for California Education (PACE), University of California, Berkeley, 2010) gathered information on resources used for start-up and operation of college-and-career pathways at the site level. Did not include district-level costs, or contributions by employers.
PACE study sites • 4 CPAs, ranging from 90 students (planned to grow to 150) to 360 students • 3 self-contained, stand-alone high schools, ranging from 212 students (planned to grow to 450) to 436 students • 3 semi-autonomous high schools sharing campuses with others, ranging from 325 to 509 students
Comparing cost per student in CPAs and other pathways CPA curriculum includes on average 45% of a student’s total coursework in grades 10-12. The other pathway programs provide 100% of a student’s coursework. Therefore, in computing costs per student, each CPA student was counted as only 45% of a student FTE. This adjustment more than doubles the computed costs per student in CPAs.
Measuring additional resources used for operating college-and-career pathways • Additional resources mainly consist of extra time for teachers, counselors, and administrators –– e.g., professional development, curriculum planning, student recruitment, student support • Respondents were asked how much extra time, if any, they spent on specific activities compared to a traditional h.s. program
Findings on additional operating cost per FTE student per year • CPAs ranged from $505 to $1,458 • Stand-alone, self-contained schools ranged from $1,792 to $1,937 • Semi-autonomous schools on shared campuses ranged from $870 to $951
Additional operating cost per FTE student is lower in older programs Operating cost per student Year of start-up
Measuring start-up cost • Staff time to plan new program; amortized over 5 years • Equipment and materials specifically dedicated to new program; amortized over 5 years • Special features of new or remodeled facilities specifically related to industry or career theme; amortized over 30 years • No information was collected on 3 oldest sites
Findings on start-up cost per FTE student, annualized • CPAs (2 programs): ranged from $181 to $559 • Stand-alone, self-contained schools (3 programs) ranged from $36 to $624 • Semi-autonomous schools on shared campuses (2 programs) ranged from $181 to $193 • Computation of start-up cost per student used planned total enrollment for 2 programs that did not yet have students at all grade levels
Findings on total additional cost: operating plus start-up • In 7 newest programs, for which start-up information was collected, total additional cost (additional annual operating cost plus annualized start-up cost) ranged from $1,111 to $2,436 per FTE student. • But additional operating cost is higher in newer programs. • Fair estimate of typical total additional cost would be about $1,500 per FTE student.
Three ways to pay additional cost • Cash grants from State (e.g., for CPAs), or from philanthropies or other sources specifically for these programs • Reallocation of resources (including paid time) from other categoricals (Tier 3) or from district general fund • Contributions of uncompensated extra time by teachers, counselors, and administrators; also community partners (not in PACE study)
Comparing estimated cost of CPAs from PACE and CASN studies (1) • CASN study found average $547 State grant per CPA student enrolled (not FTE) • CASN study also found CPAs reported additional $853 per student in district matching contributions, mainly in kind • $547 State grant + $853 district match = $1,400 State and local contribution per CPA student • If district match = State grant, total State and local contribution = $1,094 per CPA student
Comparing estimated cost of CPAs from PACE and CASN studies (2) • 4 CPAs in PACE study had annual additional operating cost per FTE student ranging from $505 to $1,458; midpoint approximately $1,000; two newer CPAs had total annual cost (operating + start-up) of $1,505 and $2,017 • Since one enrolled CPA student = 0.45 FTE, $1,500 cost per FTE = $675 cost per enrolled student, which is more than the State grant but less than State + local contribution
Policy implications (1) 1. Continue State funding for existing CPAs • Evaluations since the 1980’s, including the MDRC experimental study, have consistently found career academies produce positive impacts on students; see Evidence on Career Academies and Linked Learning at http://casn.berkeley.edu/resources.php?r=303&c=1 • Cost is less than benefit to State and local taxpayers, which itself is less than half of total benefit
Policy implications (2) • Continue CPA State funding as separate categorical grant, not part of block grant, because of unique combination of features: • Evidence of effectiveness is especially unusual for high school programs • Reporting and accountability procedures include performance-based funding • Matching contributions from employers provide additional resources ($997 per student in CASN study) and ensure local oversight
Policy implications (3) • Consider eliminating requirement for district matching contribution in CPA grant • Amounts reported in CASN study seem to exceed actual resource requirements in PACE study • Would eliminate a compliance issue • But keep matching requirement for employers 4. Seek to expand funding for CPAs and other college-and-career pathways with Linked Learning district-level support structures