Download
1 / 11
140 likes | 341 Vues
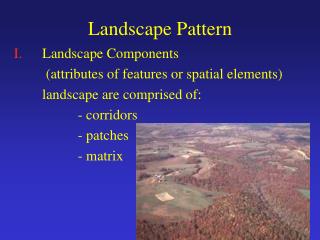
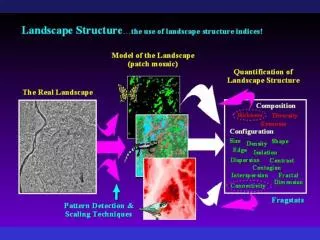
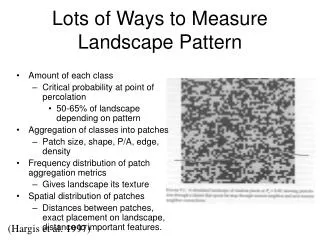
Lots of Ways to Measure Landscape Pattern. Amount of each class Critical probability at point of percolation 50-65% of landscape depending on pattern Aggregation of classes into patches Patch size, shape, P/A, edge, density Frequency distribution of patch aggregation metrics

E N D
Lots of Ways to Measure Landscape Pattern • Amount of each class • Critical probability at point of percolation • 50-65% of landscape depending on pattern • Aggregation of classes into patches • Patch size, shape, P/A, edge, density • Frequency distribution of patch aggregation metrics • Gives landscape its texture • Spatial distribution of patches • Distances between patches, exact placement on landscape, distance to important features. Fig 9.1 here (Hargis et al. 1997)
Relating Wildlife Populations to Landscape Variables • We selected 4 variables that were minimally correlated • Number of Patches • Contrast-weighted Edge Density • Juxtaposition • Mean Shape Index High Low (Marzluff et al. 2003)
Multiple Regression Produces a Resource Utilization Function • Relative Use = 1.32 - 0.14 (Mature Forest) - 0.29 (Clear cut) + 0.09 (Number of Patches) + 0.005 (Contrast-weighted Edge) - 0.002 (Patch Juxtaposition) + 0.14 (Patch Shape) Use:Availability Can Be Incorporated to Any Degree Desired Use is a CONTINUOUS MEASURE
Relative Importance of Resources at the Population Level (n = 25) Decreasing Importance * Use in direction predicted if jays select for edgy, fragmented areas within their home range
Relative Importance of Resources at the Population Level (n = 25) Pattern more important than type of vegetation Greater use of areas with many patches and edge as expected Decreasing Importance * Use in direction predicted if jays select for edgy, fragmented areas within their home range
Relative Importance of Resources at the Population Level (n = 25) Decreasing Importance Population Not Consistent in Use of Resources * Use in direction predicted if jays select for edgy, fragmented areas within their home range
Another way to Relate Use to Habitat • Map the similarity between habitat at point Z and habitat used • Vector of habitat attributes measured at used sites and all points in landscape • Calculate the similarity between point in landscape and average vector of used habitat • Mahalanobis distance
Mahalanobis Distance Measure of dissimilarity between sample habitat characters (x) and ideal habitat represented by u.
Example of Mahalanobis Distance Probabilities • Clark et al. 1993 • Black Bears in Arkansas • Yellow depicts areas where habitat characters approach the ideal mean habitat vector
Another Example • Black-tailed Jackrabbits in Southwestern Idaho • Managers Know where to focus restoration efforts and where to reduce chance of wildfire • Knick and Dyer 1997