Download
1 / 30
300 likes | 388 Vues
Explore the successful collaboration between the City of San José and San José State University in achieving zero waste goals through case studies and partnerships. Learn about sustainable urban planning projects and initiatives towards a greener city.

E N D
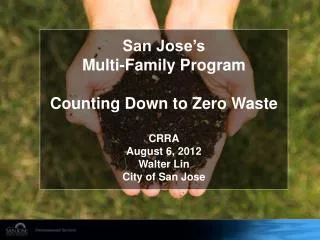
Leveraging Public Universities to Meet Zero Waste Goals Case Studies of the Partnership Between City of San José and San José State University Emy Mendoza Zero Waste Planner City of San José
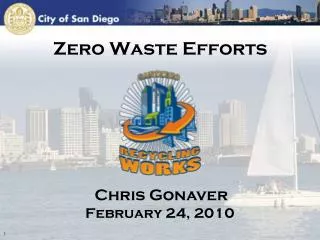
San José Green Vision • 25,000 Clean Tech jobs • Reduce per capita energy use by 50 percent. • All electrical power from clean renewable sources. • Build or retrofit 50 million square feet green buildings. • Divert 100 percent of waste from landfill and convert waste to energy.
San José Green Vision • Recycle or beneficial reuse 100 percent wastewater. • General Plan measurable standards for sustainable development. • 100 percent public fleet vehicles on alternative fuels. • 100,000 new trees, replace 100 percent of streetlights with smart, zero-emission lighting. • Create 100 miles of interconnected trails.
Partnerships? City of San José + San José State University, Urban Planning Dept.
= • Las Plumas Eco-Park (HHW site development with Environmental Planning class) • Commercial Redesign District Study (with Urban Planning studio class)
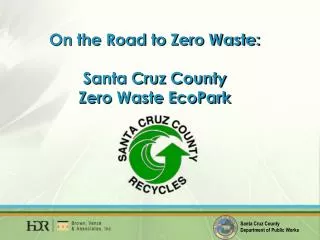
Case Study 1: Las Plumas Eco-Park • June 2006 - Property acquired • Fall 2006 - Environmental Planning Class • Spring 2007 – Class Project & Community Engagement • June 2007 - San José City Council
Numerous potential uses Eco playground Native American plant garden Building materials reuse
Numerous potential uses Eco playground Green building demonstration Native American plant garden Solar panel demonstration Building materials reuse
Numerous potential uses Eco playground Green building demonstration Native American plant garden Solar panel demonstration Building materials reuse Environmental education center Living Roof
Proximity ___ ___ __
Case Study 2: Fall 2008 Commercial Redesign Urban Planning Students GIS Mapping of Waste Stream
Urban Planning Studio Class Works with a local community On a real-life problem or project
Student Work included: • History of waste management • Environmental education – Cradle to Cradle, The Story of Stuff • Commercial Redesign ‘problem’
Data Sources • Business Permit Data • 27,000 businesses • Addresses • SIC codes • Numbers of employees • Hauler Data • Actual waste collection • By zip codes • Broken into waste types
Projected Annual Waste Generation • California Integrated Waste Management Board (CIWMB) disposal rates: • Industry-specific waste generation rates per employee • Joined with business permit data • Projected tonnage of annual waste generation • Mapped results using GIS • Identified concentrations of commercial waste
Example: Il Fornaio Restaurant Business Permit Data • 302 S. Market Street • 87 employees • 2 Digit SIC Code: 58 Annual Waste Generation • __ employees x __ lbs/wk/employee* • 87 x 119 lbs/week = 10,353 lbs/week • x 52 wks/yr = 538,356 lbs/yr • ÷ 2000 lbs/ton = 269 tons/yr*CIWMB Disposal Rates Source: http://farm3.static.flickr.com/2057/2060624195_4503c91714.jpg?v=0
Recommended System • Two geographic collection districts • Two haulers for most standard services • Performance standards • Exclude construction & demolition debris