Download
1 / 53
530 likes | 606 Vues
This poetic and scientific exploration delves into evolutionary patterns from micro to macro scales, examining how we perceive and study evolution through varied lenses. The text follows Rumi's allegory of blind men describing an elephant, intertwining with discussions on phylogeny, body size traits, and evolutionary models. By merging field, fossil, and comparative data, it seeks to unravel the mysteries of genetic drift, selection, and evolutionary time spans. The narrative contemplates the stochastic nature of evolution, offering insights into species life spans, taxon cycles, and the impact of demography and extinction. Through a blend of poetry, philosophy, and empirical evidence, it beckons readers to ponder the intricate dance of evolution across diverse temporal scales.

E N D
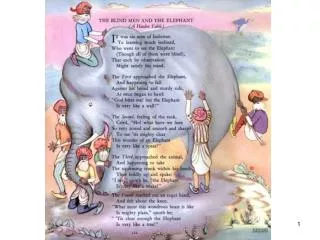
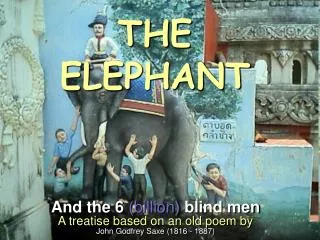
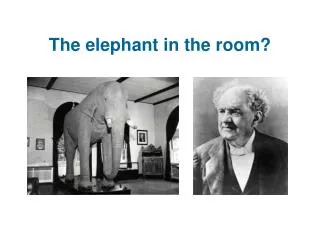
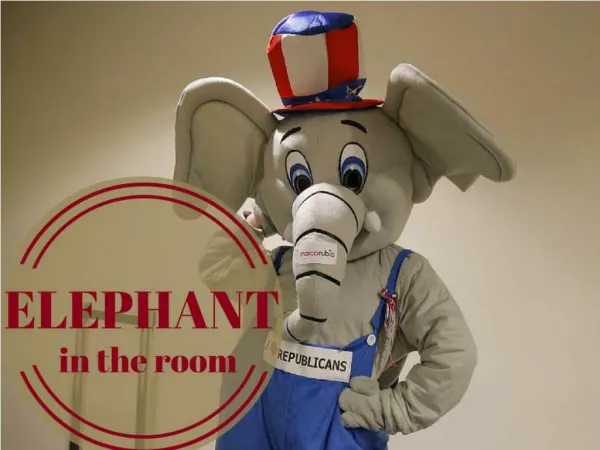
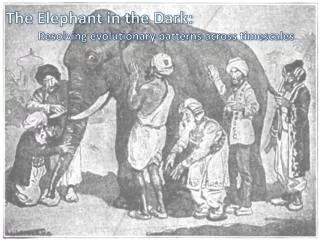
The Elephant in the Dark: Resolving evolutionary patterns across timescales
… One by one, we go in the dark and come out Saying how we experience the animal One of us happens to touch the trunk. “A water-pipe kind of creature.” Another, the ear. “A very strong, always moving Back and forth, fan-animal.” Another, the leg. “I find it still, Like a column on a temple.” Another touches the curved back. “ A leathery throne” Another, the cleverest, feels the tusk. “A rounded sword made of porcelain.” He’s proud of his description. Each of us touches one place And understands the whole in that way. The palm and fingers feeling in the dark are How the senses explore the reality of the elephant If each of us held a candle there, And if we went in together, We could see it. -The Elephant in the Dark Rumi (Translated by Coleman Barks)
Another, touches extant populations,… “A very strong, always moving back and forth [process]”
Another, the fossil record, … “I find it still, like a column on a temple [with occasional punctuations]”
Another, the phylogeny… …Brownian Motion might be a good approximation.
How can we see the pattern across scales of time? All studies of phenotypic evolution measure comparable quantities Allochronic Synchronic Time interval Pop A mean(z) Pop X Pop A mean(z) Pop B mean(z) Pop B mean(z) Time interval We measure two quantitaties: (1) “time for evolution” (2) Δ mean
Estes and Arnold 2007 Field Studies Historic Fossil Record Divergence isn’t dependent on time?
Why is there no time-span effect? • How can this be consistent with strong phylogenetic signal for body size traits? Thomas F Hansen University of Oslo
Body size is known to have a strong phylogenetic signal Smith et al. 2004. Phylogenetic heritability of body size between sister species of mammals (think of the plot like a sib-sib regression)
Estes and Arnold 2007 Field Studies Historic Fossil Record Divergence isn’t dependent on time?
Estes & Arnold (2007) • Neutral drift in trait or adaptive optimum • Stabilizing selection • Displaced optimum • Moving optimum • White noise motion of the optimum • Peak shift
Example: Brownian Motion process Time (Raw timescale)
Example: Brownian Motion process Time (Raw timescale)
Example: Brownian Motion process Time (Log timescale)
Let’s combine with comparative data: • Log-scaled linear body size traits • e.g. ln(height) or ln( mass1/3) • Taxa- Many, but mostly vertebrates • Field and historic data (e.g. Hendry et al. 2008) • Fossil record (e.g. Gingerich 2001) • Comparative data: • Time-calibrated phylogenies & body size databases • Mammals, Birds & Squamates
Comparative data Mammals
Comparative data Birds
Comparative data Squamates
Comparative data Mammalian, Avian and Squamate body size
“The Evolutionary Blunderbuss” ™ Stevan J Arnold Comparative data Mammalian, Avian and Squamate body size
Models must explain: “The Stasis Distribution” and Longer term trends of accumulating variance
Stochastic models • Bounded Evolution (BE) • Brownian Motion (BM) • Single-burst (SB) – Exponential time to displacement • Multiple-burst (MB) – Poisson Point Process
Multiple-Burst Model • Punctuational change • Stasis distribution: ± 10% linear size change (1 SD) (ME + phenotypic plasticity + evolutionary change + genetic drift) • Burst distribution: ± 30% linear size change (1 SD) Average time to displacement = 25 my
Why millions of years?What process accounts for this pattern?
What pattern makes evolution look like Brownian motion over macroevolutionary time? • Genetic drift (Lande 1976)? • No, parameters do not work • Drift of a local adaptive peak? • No, or we could never measure selection • A statistical pattern in need of an interpretation
What then, is randomly walking? • “Niches” • Not a real answer • We need more focus on interpretation and causation!
Is there anything significant about 1-5 milllion years? • Species life-spans for mammals are ~1-5 million years (Alroy et al. 2000; Liow et al. 2008) • Marine inverts 2.5-10 my (Foote, 2007) • Taxon cycles are suggested to occur on the order of 0.1-10 my (Ricklefs & Bermingham 2002)
What role could demography & extinction play? • Similar to models proposed by Eldredge et al. (2005) • As fitness-related mean trait value deviates from θ, mean population fitness declines according to a Gaussian function.
Population growth (Burger & Lynch 1995) • Let the population grow at a multiplicative growth rate, Rt, such that: and when , otherwise . • where B is the maximum population growth rate and K is the carrying capacity.
Constant population size: Divergence increases with time Addition of demography: Divergence decreases with time G/(ω2+1)=0.01 σ2ө = 2.25 λ = 1/250, Linear increase in average divergence expected G/(ω2+1)=0.01 σ2ө = 2.25 B=1.025 λ = 1/250 N0 = 10000