Download
1 / 20
210 likes | 340 Vues
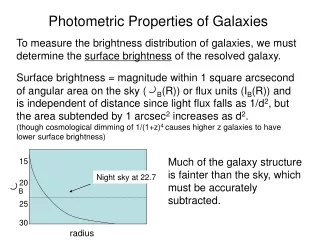
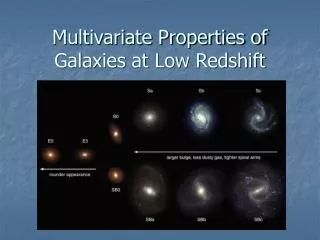
Multivariate Properties of Galaxies at Low Redshift. Galaxy Properties from Imaging. Luminosity functions Star formation rate Stellar mass Morphology Color-magnitude relation Environment Photometric redshift 2-D Clustering. 2 6-color SDSS scans of 2.5 ° x2.5 °.

E N D
Galaxy Properties from Imaging • Luminosity functions • Star formation rate • Stellar mass • Morphology • Color-magnitude relation • Environment • Photometric redshift • 2-D Clustering 2 6-color SDSS scans of 2.5°x2.5°.
Galaxy Properties from Spectroscopy • Detailed star formation history • Dynamical mass • Metallicity • Dust content • 3-D clustering • AGN activity
Galaxy Surveys: Optical & NIR DEEP2 AEGIS • • • • • COMBO17 MUSYC ELAIS-S1 Steidel • MS1054 From Mara Salvato’s web page
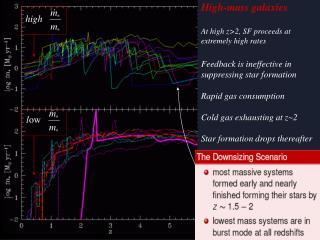
Where is the stellar mass? • Galaxies at ~1010.5-1011.5M contain most of stellar mass. • SFR and Dn show bimodality. • Some, not much, environmental dependence Kauffmann et al. 2004
Ball et al 2005 Bivariate LF’s: Morphology • Sersic index n: • n=4: elliptical • n=1: spiral • Ellipticals dominate bright end; later types at faint end. • Faint end slope varies with n; Bright end truncation invariant. • SB trends similar; high SB’s have higher n.
Ball et al 2005 Bivariate LF’s: Color • u-r measures (roughly) ratio of current to past star formation. • Red galaxies dominate at bright end. • Blue galaxies have steeper faint-end slope. • r-z distribution shows less trend, because fewer blue galaxies.
Cortese et al. 2005 LF’s in Field vs. Clusters • Field R-band LF (SDSS) well-fit by Schechter function, with a~-1.26. • Clusters show an excess population of small galaxies. • GALEX data shows faint-end upturn is from passive dwarfs. Trentham et al 2005
Stellar Mass Fcn in Field vs. Clusters • Near-IR (J, K) allow more direct tracer of M*. • Clusters show steeper faint end, field is shallow. • Non-emission line field galaxies show very shallow slope. Balogh et al 2001
Morphology-Density Relation • Ellipticals prefer denser environments. • Discovered in the 80’s, regarded as a fundamental aspect of environment. • Why does it occur? • Ram-pressure stripping? • Merging? • Harassment? • Starvation? Goto et al. 2004
It’s star formation history, stupid! • At fixed luminosity and color, there is no strong relationship between density and either Sersic index or surface brightness. • It’s not morphology-density, it’s color-density, or perhaps star formation history-density relation. Blanton et al. 2005
Color, magnitude, morphology • Ellipticals (high-n) tend to be red and high-SB. • CMD shows bimodality: “red sequence” & “blue cloud”. • Color-SB relation shows similar bimodality.
Red sequence evolution • Red sequence in place at z~1 (10 Gyr ago). • Gets slowly redder with time; zf~2+. • Dominated by early-types (not dusty spirals).
Lee et al. 2006 Mass-Metallicity Relation • SDSS emission line galaxies, central regions. • M*-Z shows a strong trend up to M*~1010.5M, then flattens to higher M*. • Scatter is small: 0.2 dex at low-M, 0.07 dex at high-M. • Origin yet unclear, but outflows likely needed. Tremonti et al. 2004
Lv4 Lv3 McGaugh 2004 Tully-Fisher and M*/L Bell & de Jong 2001 • Stellar/baryonic mass vs. dynamical mass. • ~x7 M*/L variation in B, ~x2 in K (for spirals). Tightest with B-R color. • With M*/L(color), TF has M*v4.5. • With HI data, baryonic TF Mbv3.5±0.2. • Extending to lower masses suggests Mbv4: variation with Mb? • Recall Mhalov3, so at face value small halos have less baryons: Mb/Mhv0.5.
AGNs: Where do they live? Kauffmann et al 2003 • In M*>1010M. • Morphologically similar to early-types. • OTOH, recent SF similar to late-types (esp. in strong AGN).
Kauffmann et al 2004 AGNs and galaxy evolution • AGNs roughly occupy “green valley”. • Black hole growth occuring in M*~1010.5-1011 M galaxies. • Same M* as transition in colors, SFRs, etc. • Cause or effect?
Norberg et al 2001 Clustering: 2PCF • x=(r/r0)-g, g~1.8 and r0~5 Mpc/h. • Departs significantly from pure power law. • Red galaxies have steeper x slope. • Mild luminosity dependence, strongest at luminous end. Zehavi et al. 2003, 2004
Yang et al 2004 Halo Occupation Distribution Zehavi et al 2003 • HOD = P(Ng,Mh). • Made up of “1-halo” and “2-halo” terms. • From this, get bias: b≡(xgg/xmm)1/2. • <N(M)> has character-istic shape; can derive by matching x(r).
Conditional Luminosity Function • F(L|M)dL: Luminosity fcn in bins of halo mass. • Tune F(L|M) to reproduce LF, x(L), and T-F. • Depends on cosmology, or anything that affects halo abundance. Yang et al 2003